Article
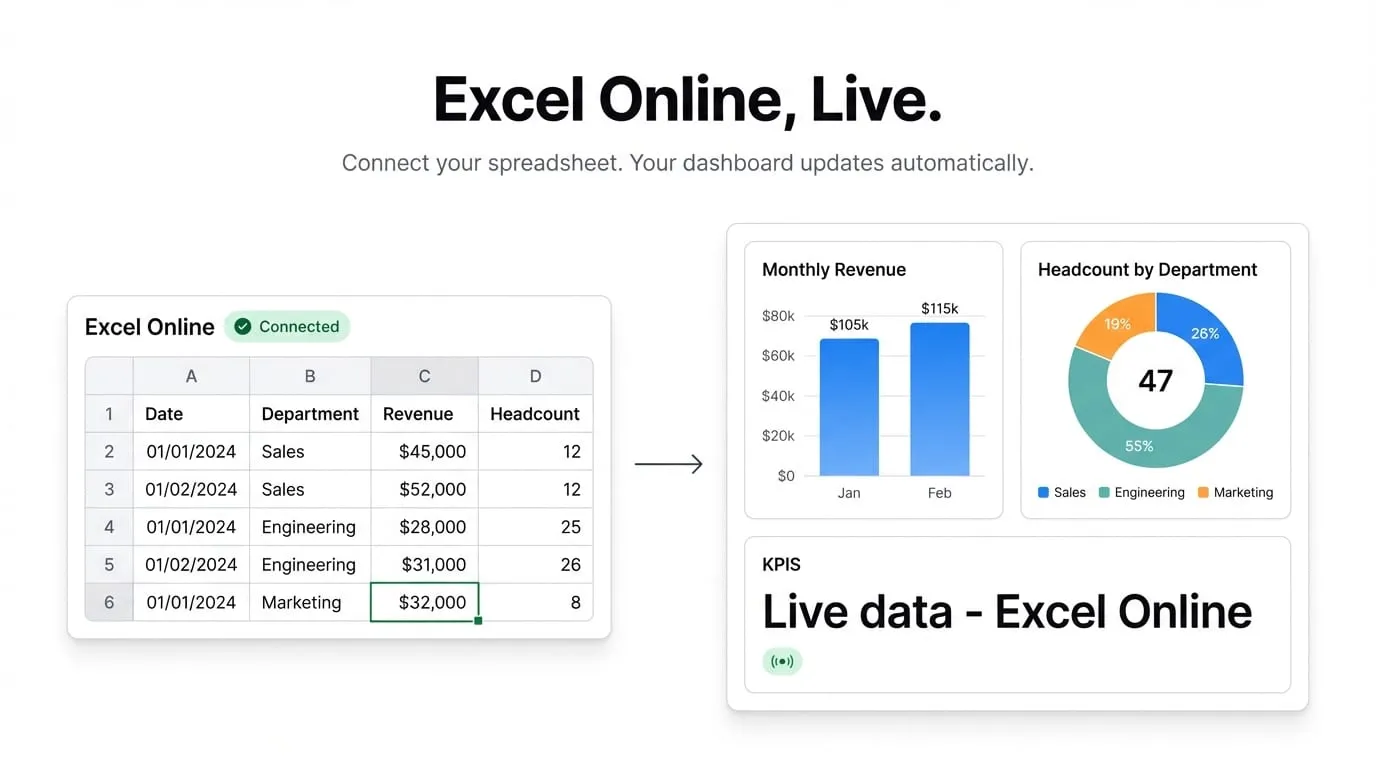
Microsoft Excel Online Dashboard: Live Data with Infograph
Connect your Microsoft Excel Online spreadsheets to Infograph and get a live, auto-updating dashboard — no exports, no copy-paste, no stale numbers.
Ideas, comparisons and answers on dashboards, reporting and the data behind them.
Article
Connect your Microsoft Excel Online spreadsheets to Infograph and get a live, auto-updating dashboard — no exports, no copy-paste, no stale numbers.
Article
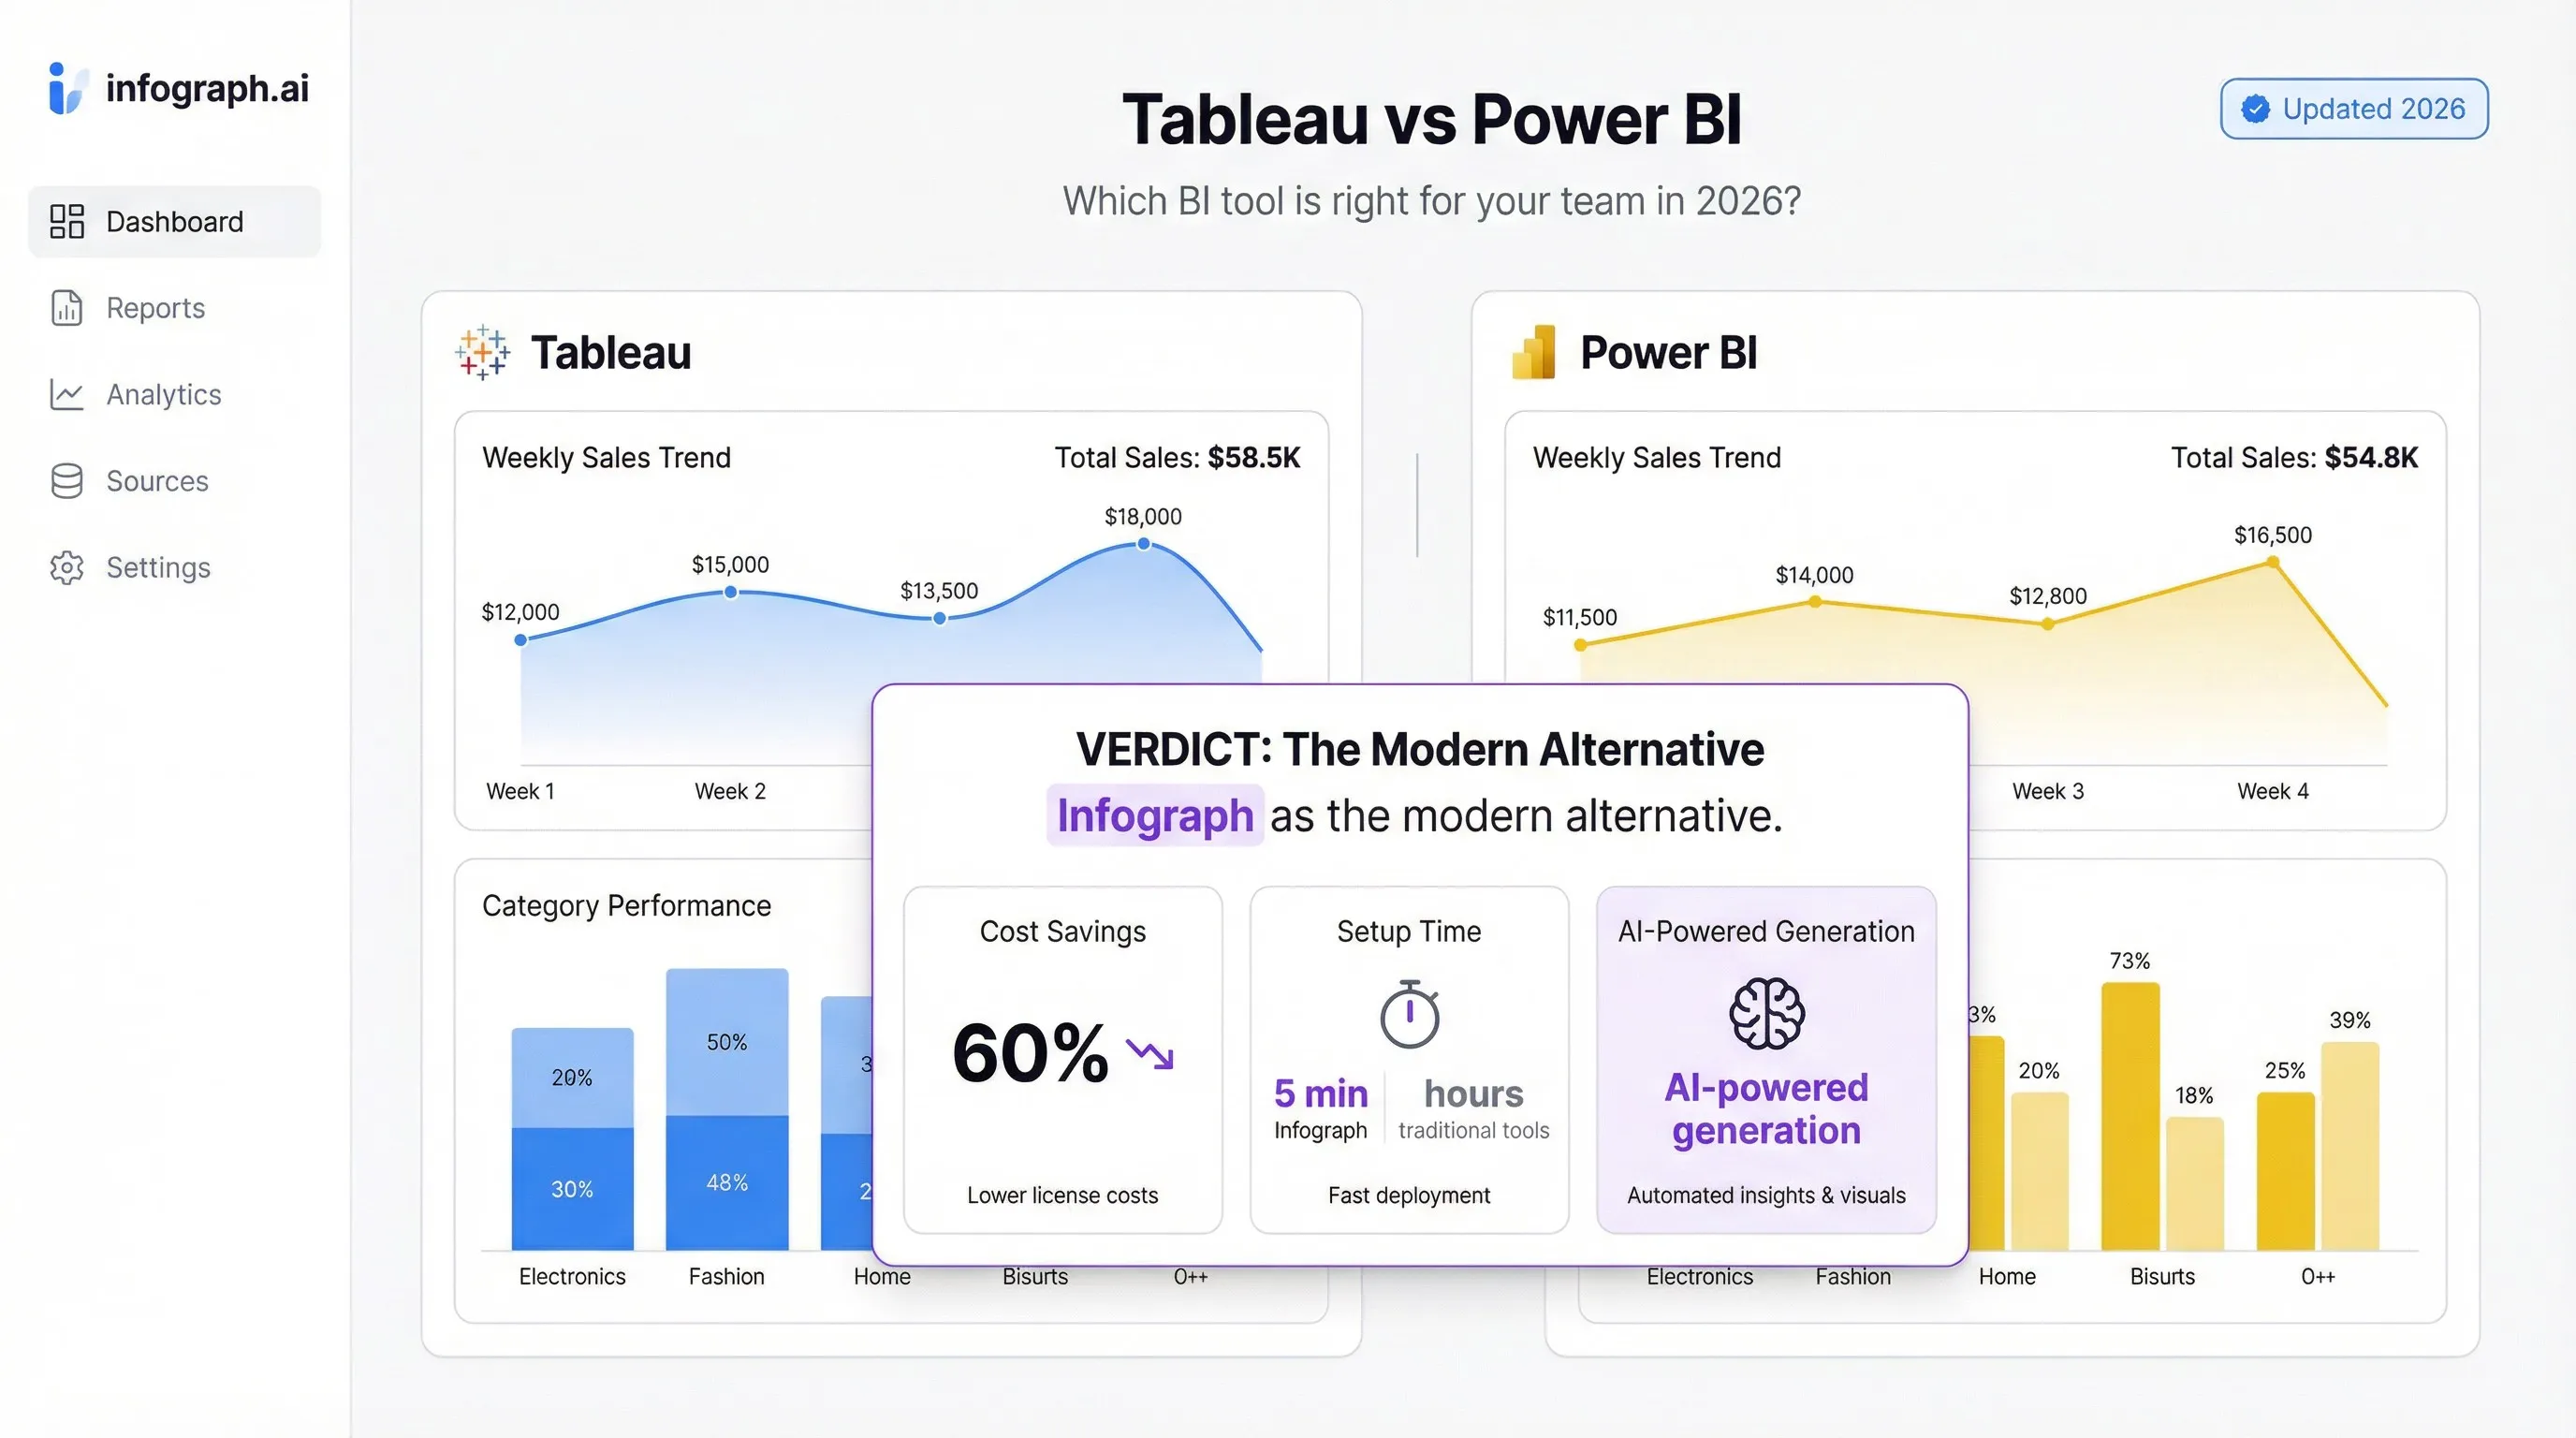
An honest comparison of Tableau and Power BI in 2026 — pricing, learning curve, strengths, and when you should consider something else entirely.
Article
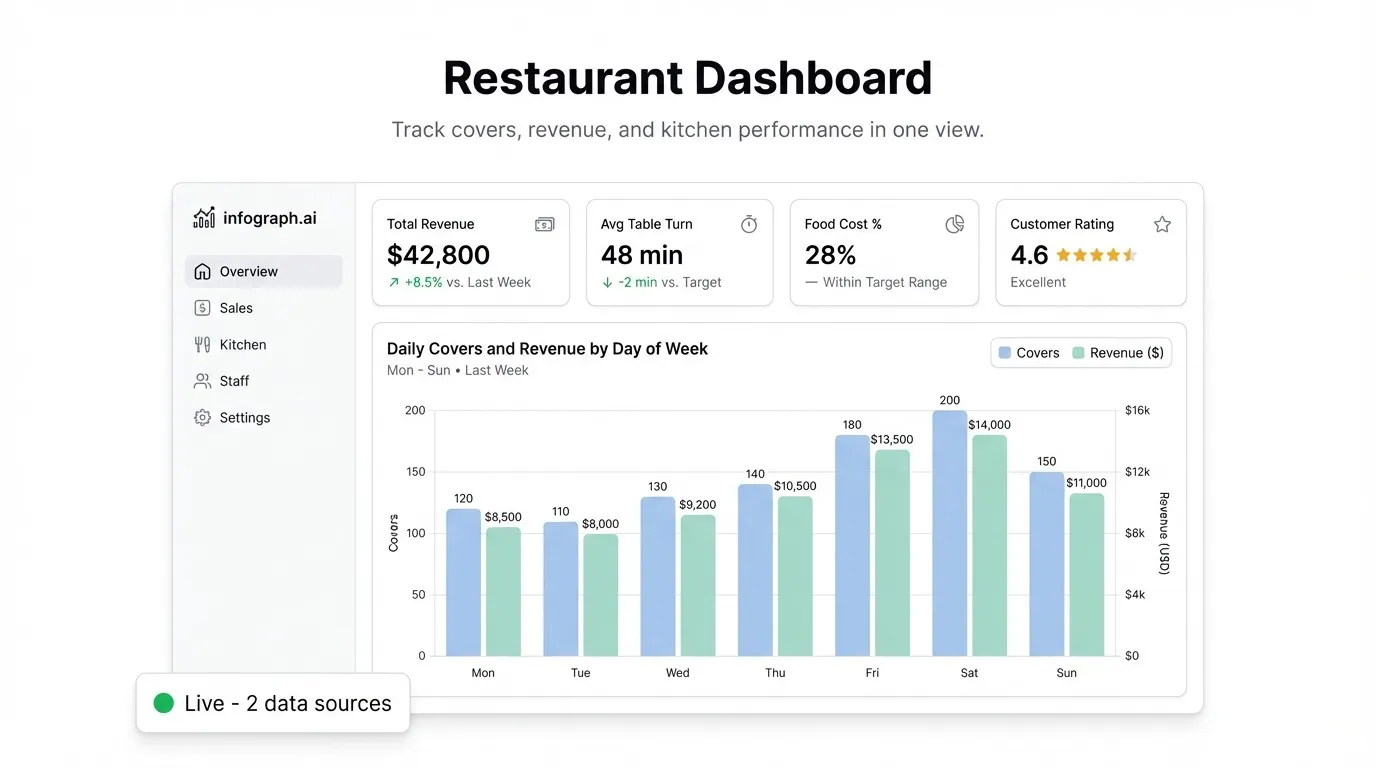
Learn how to build a restaurant dashboard that tracks daily revenue, food cost %, labor cost %, covers per hour, and top-selling items — using your existing POS exports.
Article
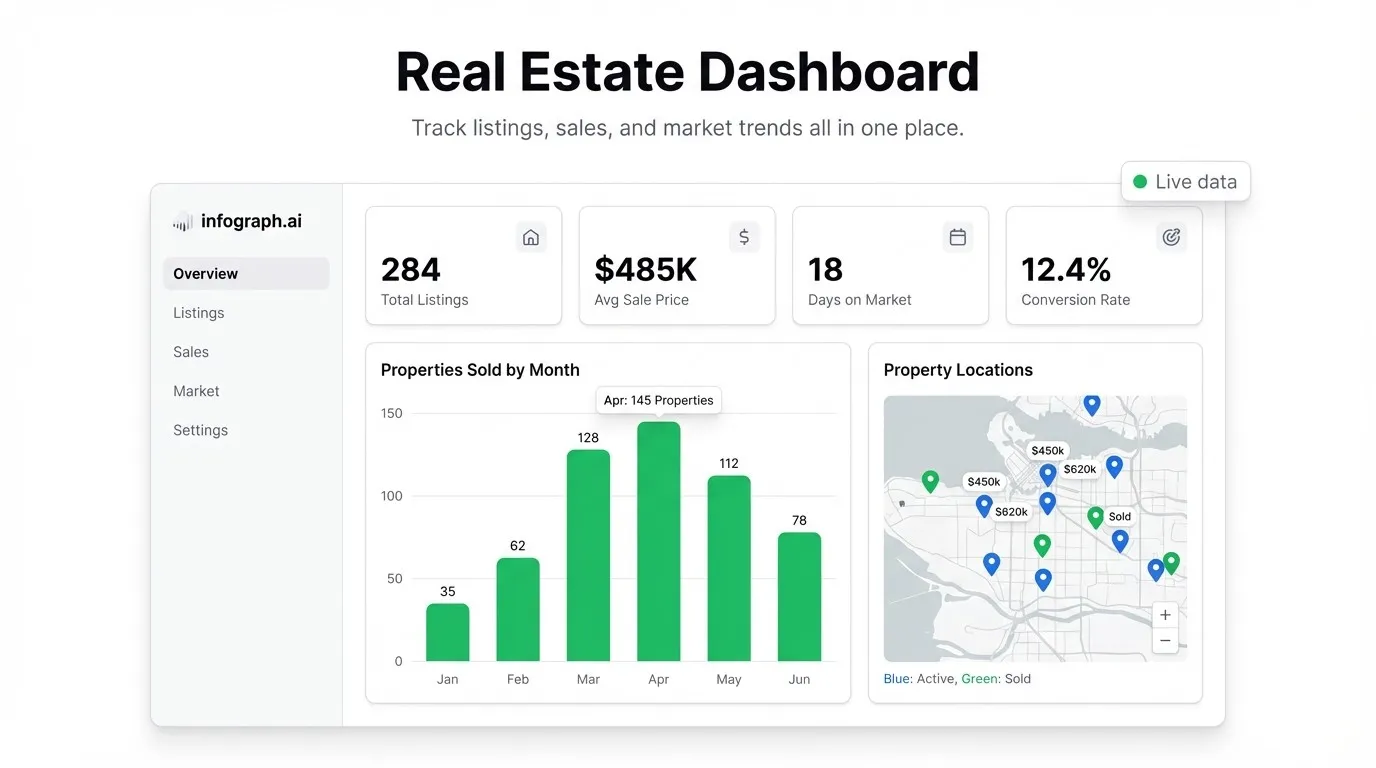
Learn how to build a real estate dashboard that tracks active listings, deal pipeline, agent performance, and commissions — without manual reporting or BI tools.
Article
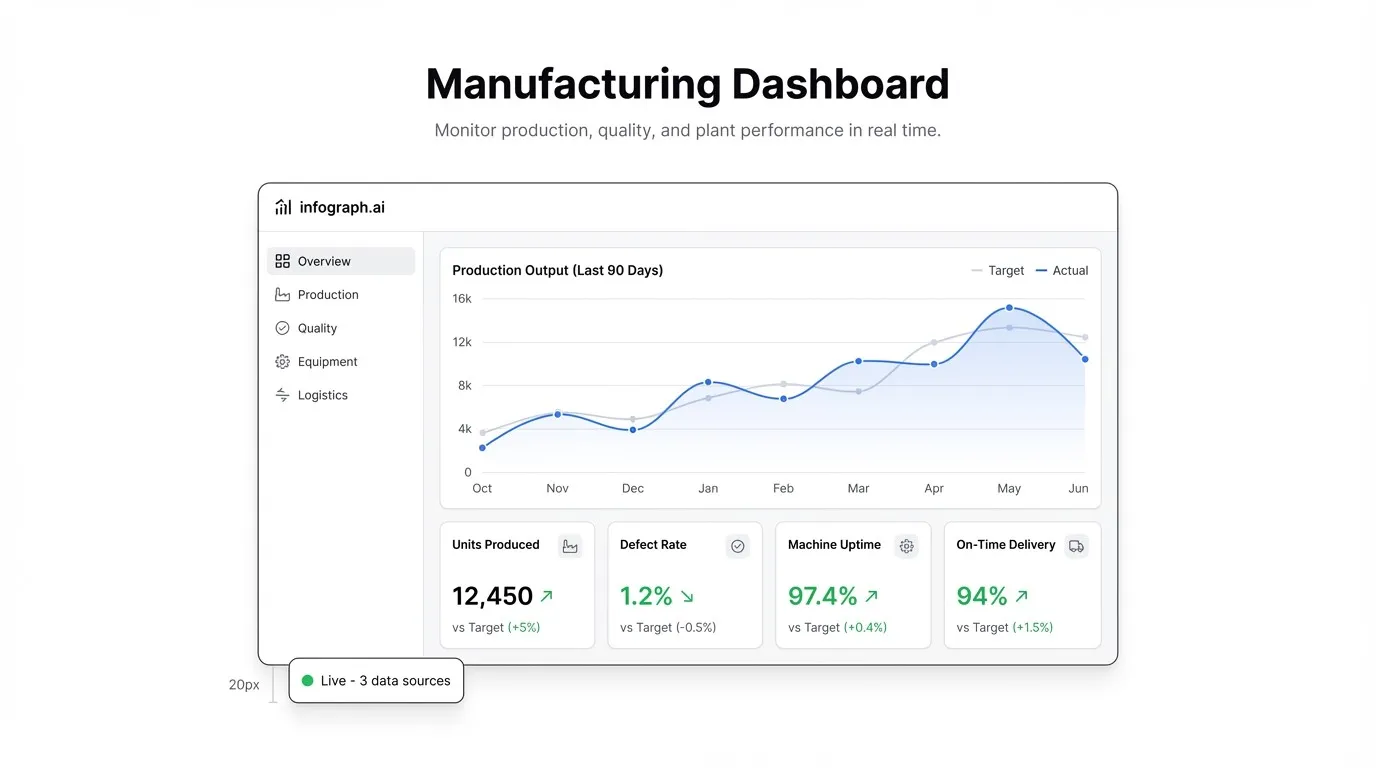
Learn how to build a manufacturing dashboard that tracks OEE, production output, downtime reasons, and quality rejection rates — without a data team or BI tool.
Article
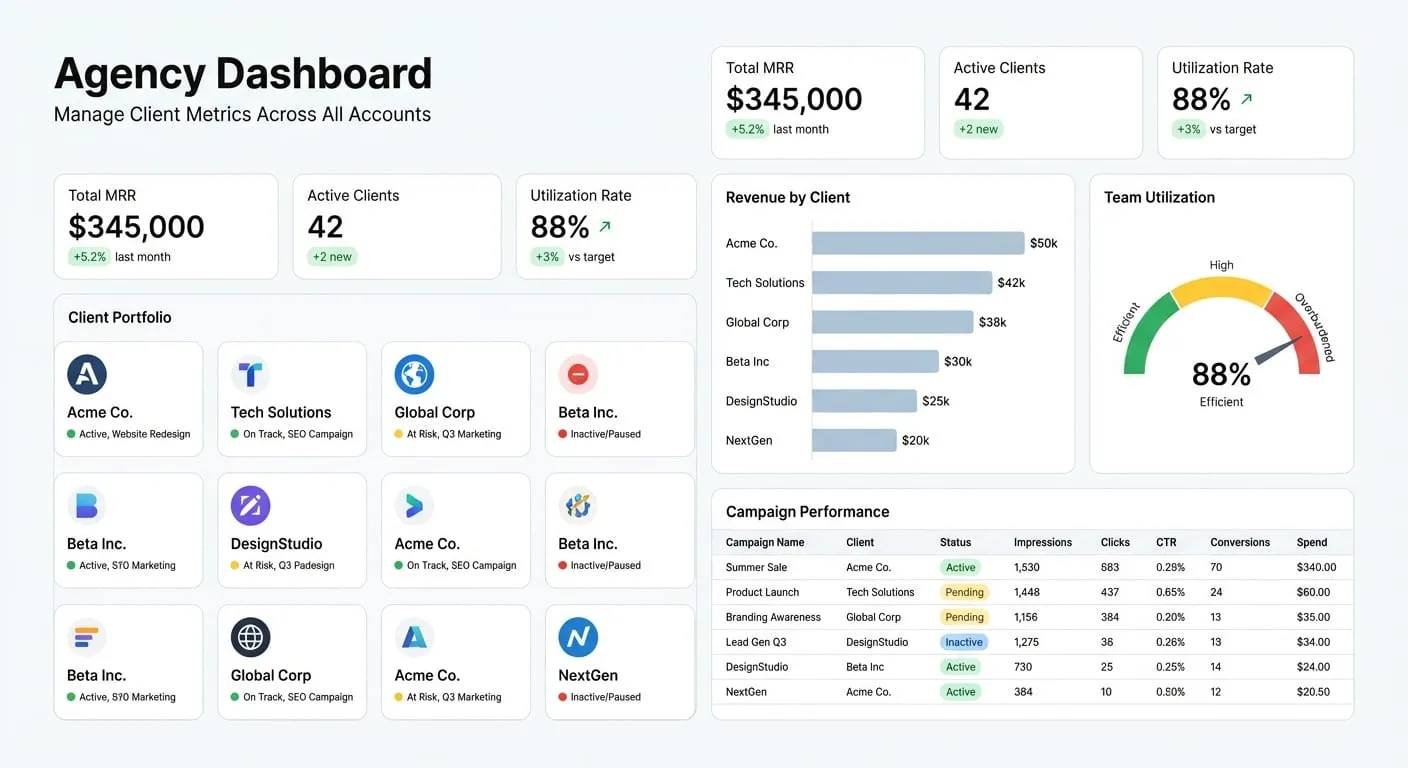
An agency dashboard centralizes client KPIs, campaign performance, and account health across all accounts in one view. Here's what to track and how to build it.
Article
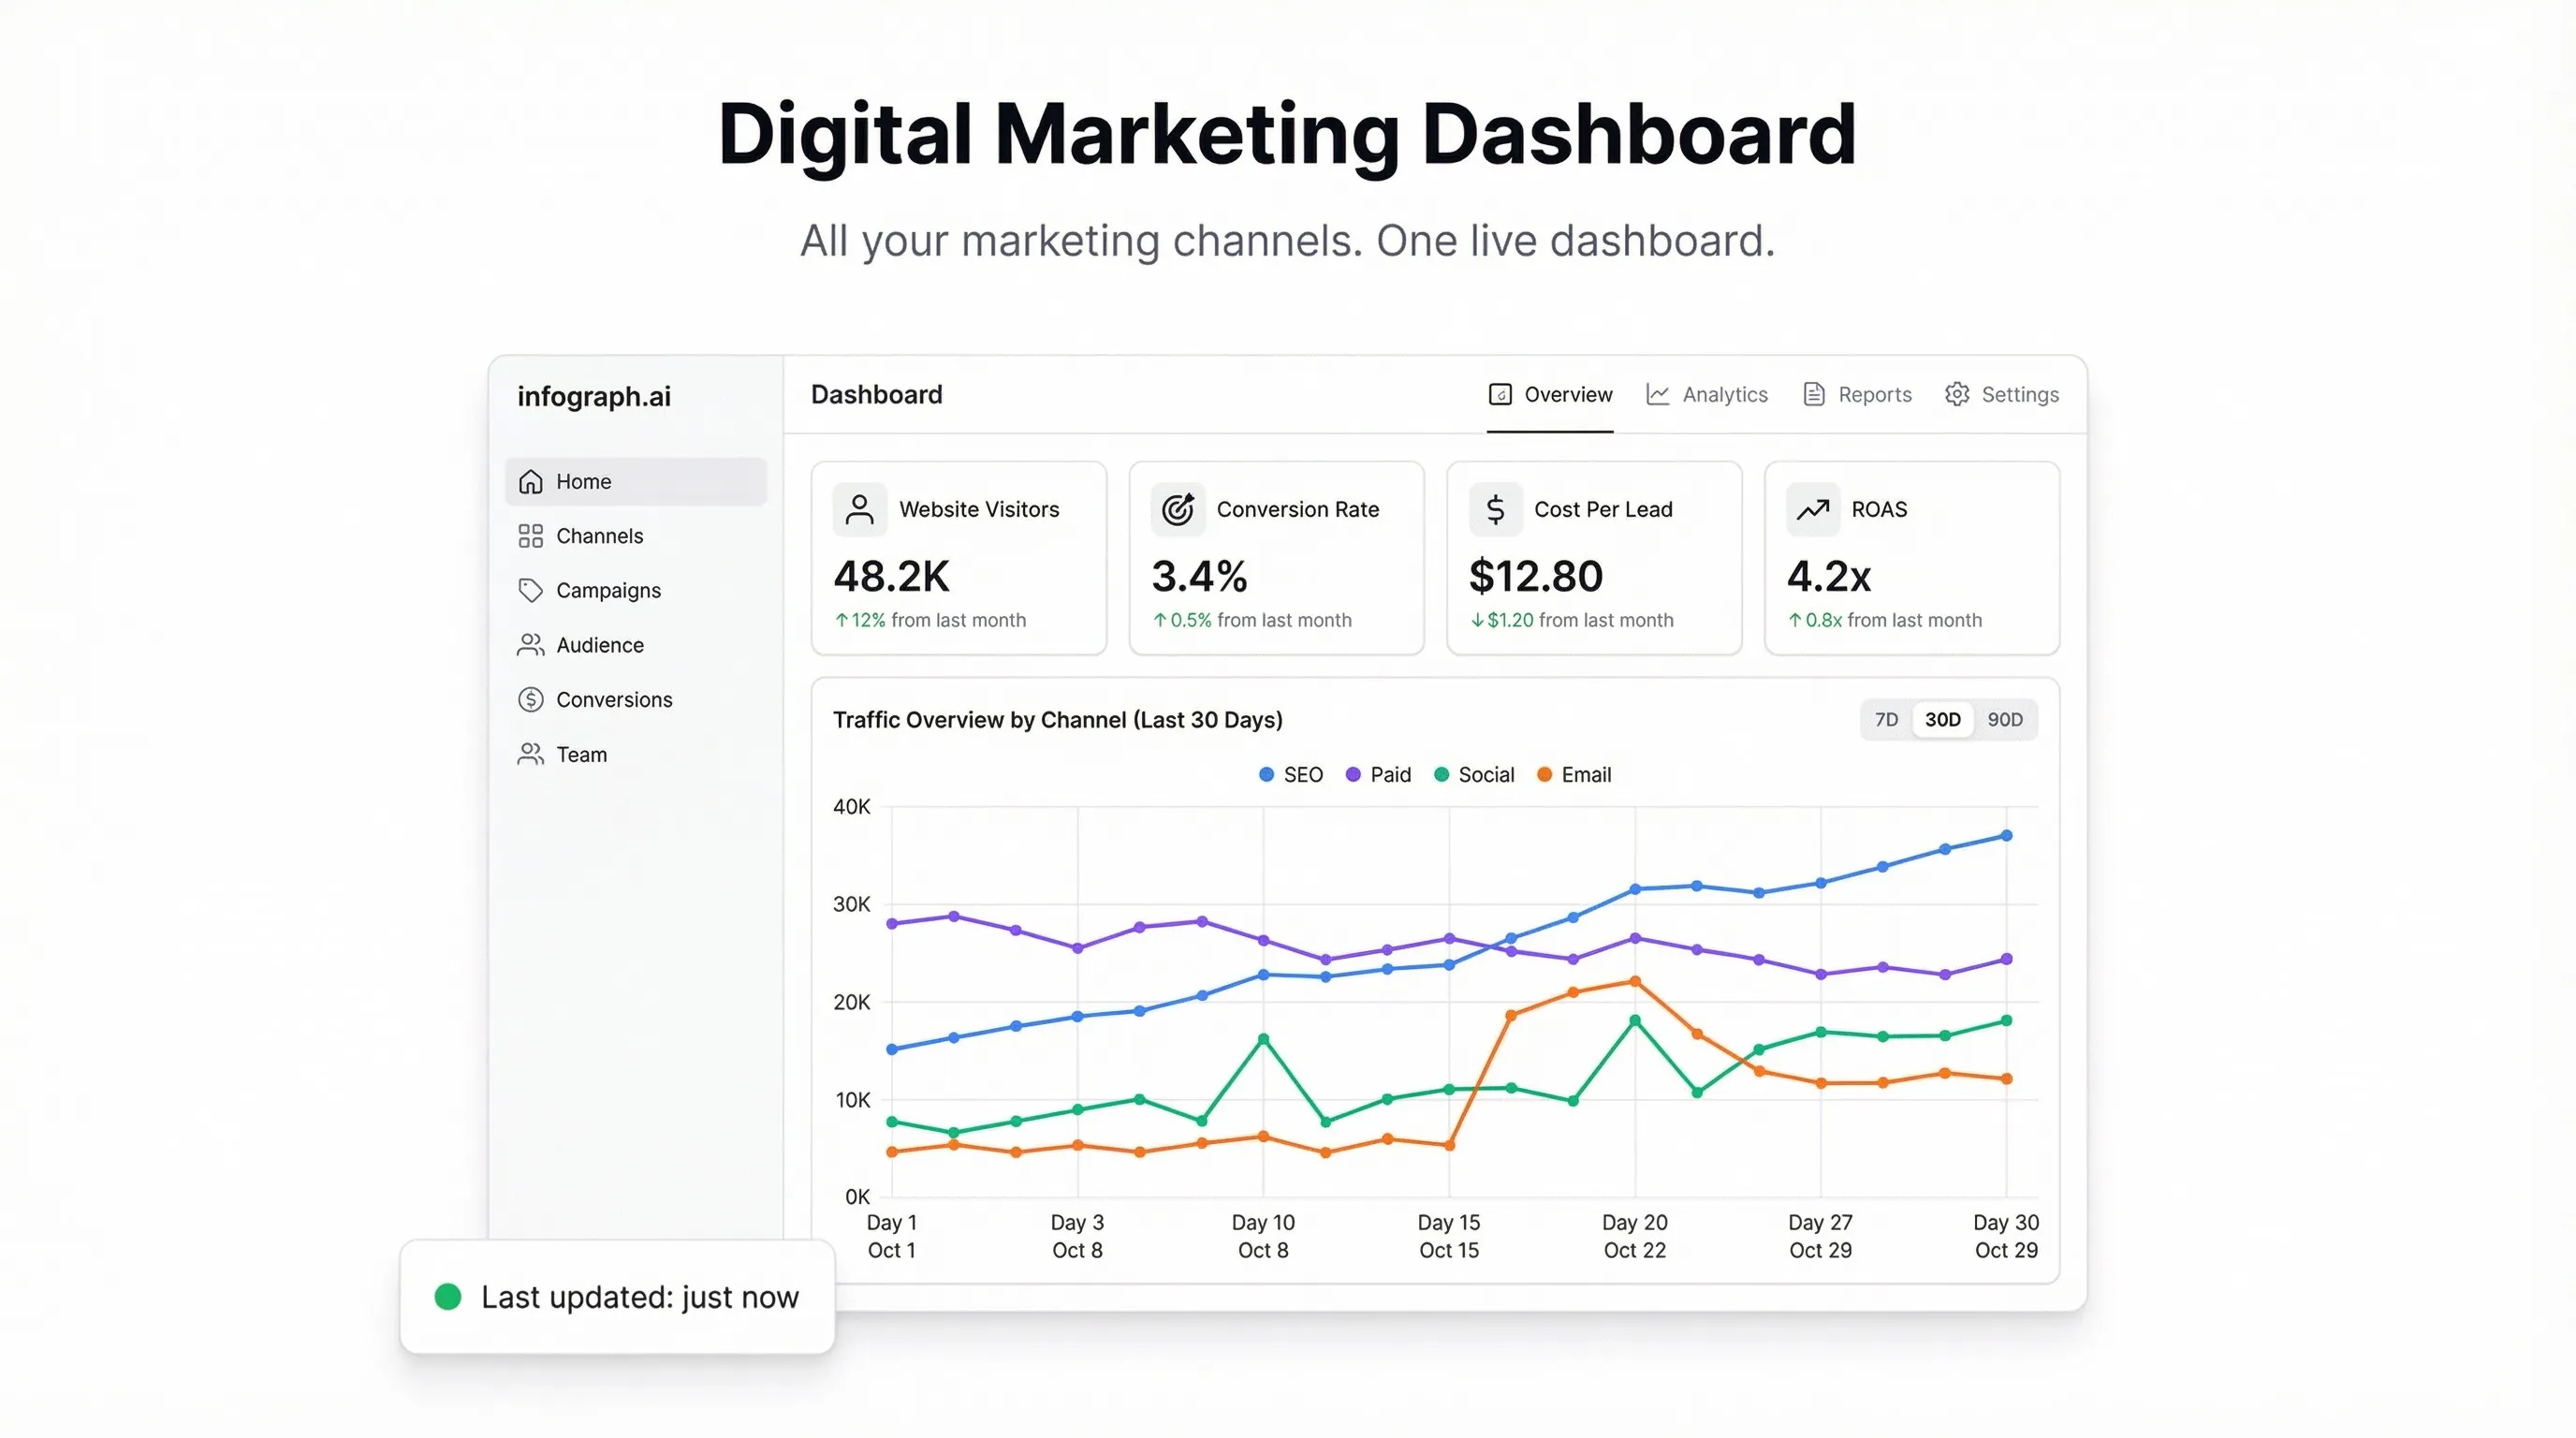
Stop switching between Google Ads, Meta Business Suite, and Analytics to piece together your marketing performance. Build a digital marketing dashboard that shows everything in one place.
Article
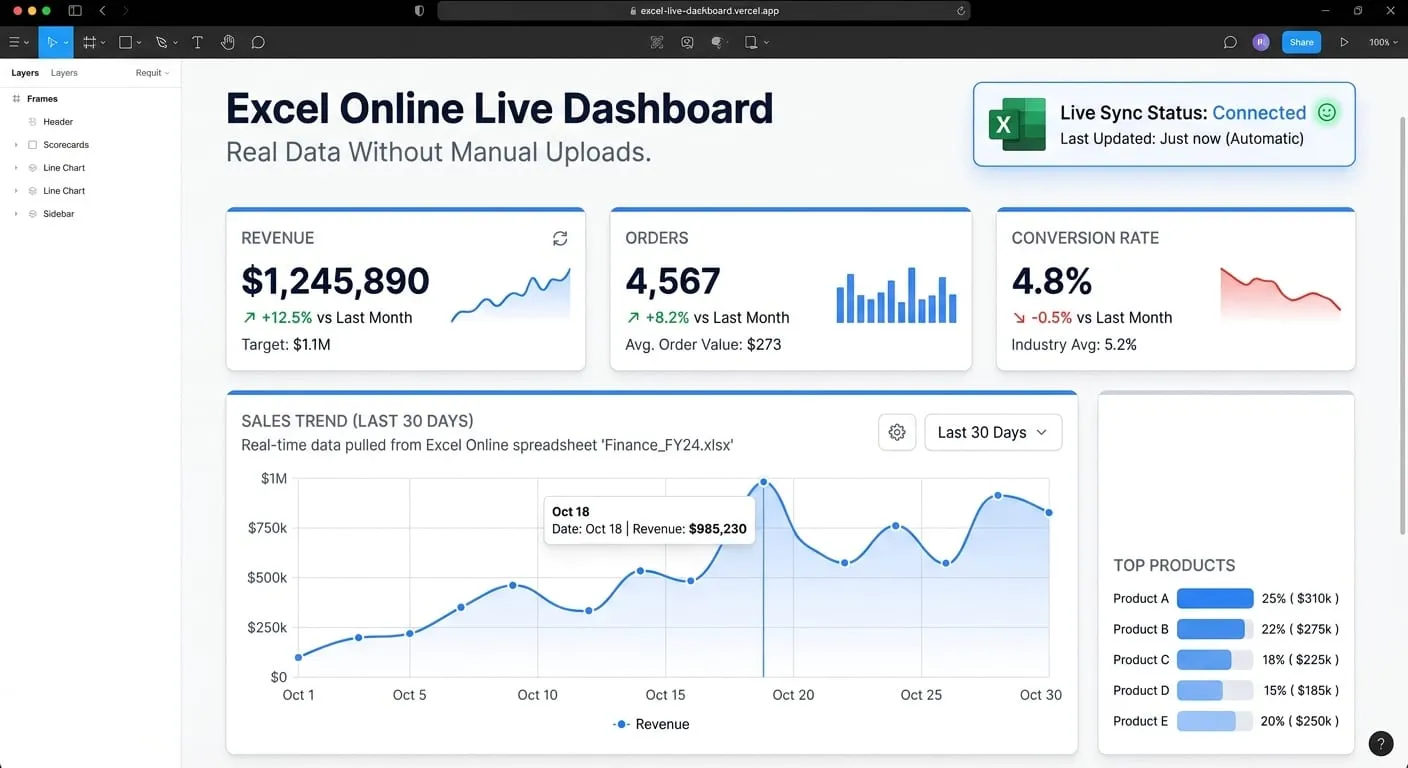
Connect Excel Online to Infograph and build a live dashboard that updates automatically when your spreadsheet changes — no manual uploads ever again.
Article
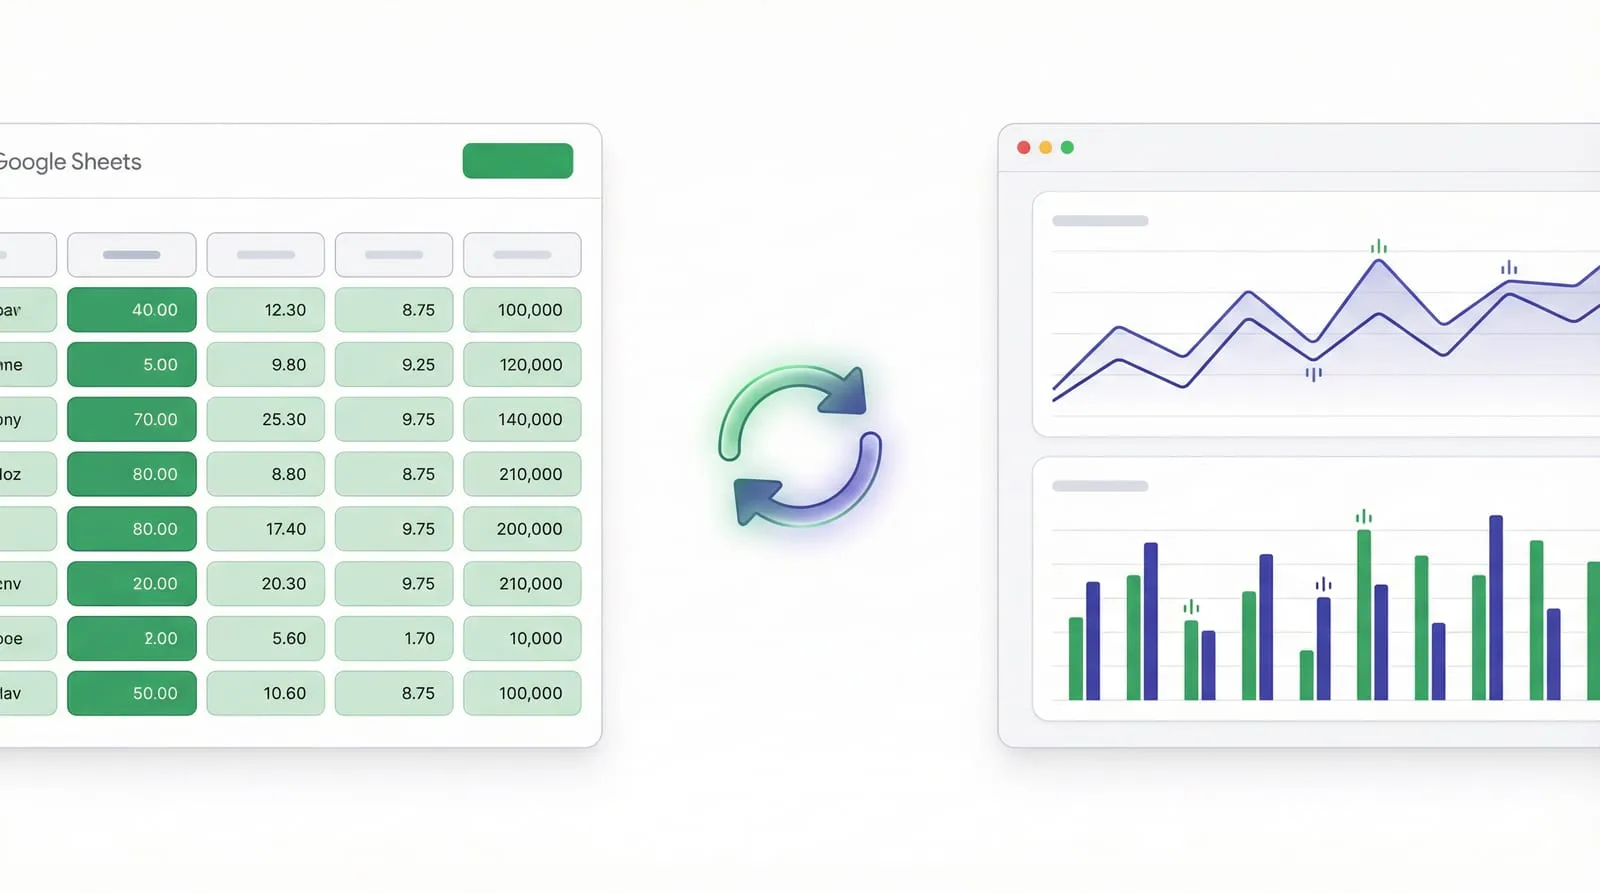
Most Google Sheets dashboard tutorials show you how to export screenshots. This one shows you how to build a dashboard that updates automatically when your sheet changes.
Article
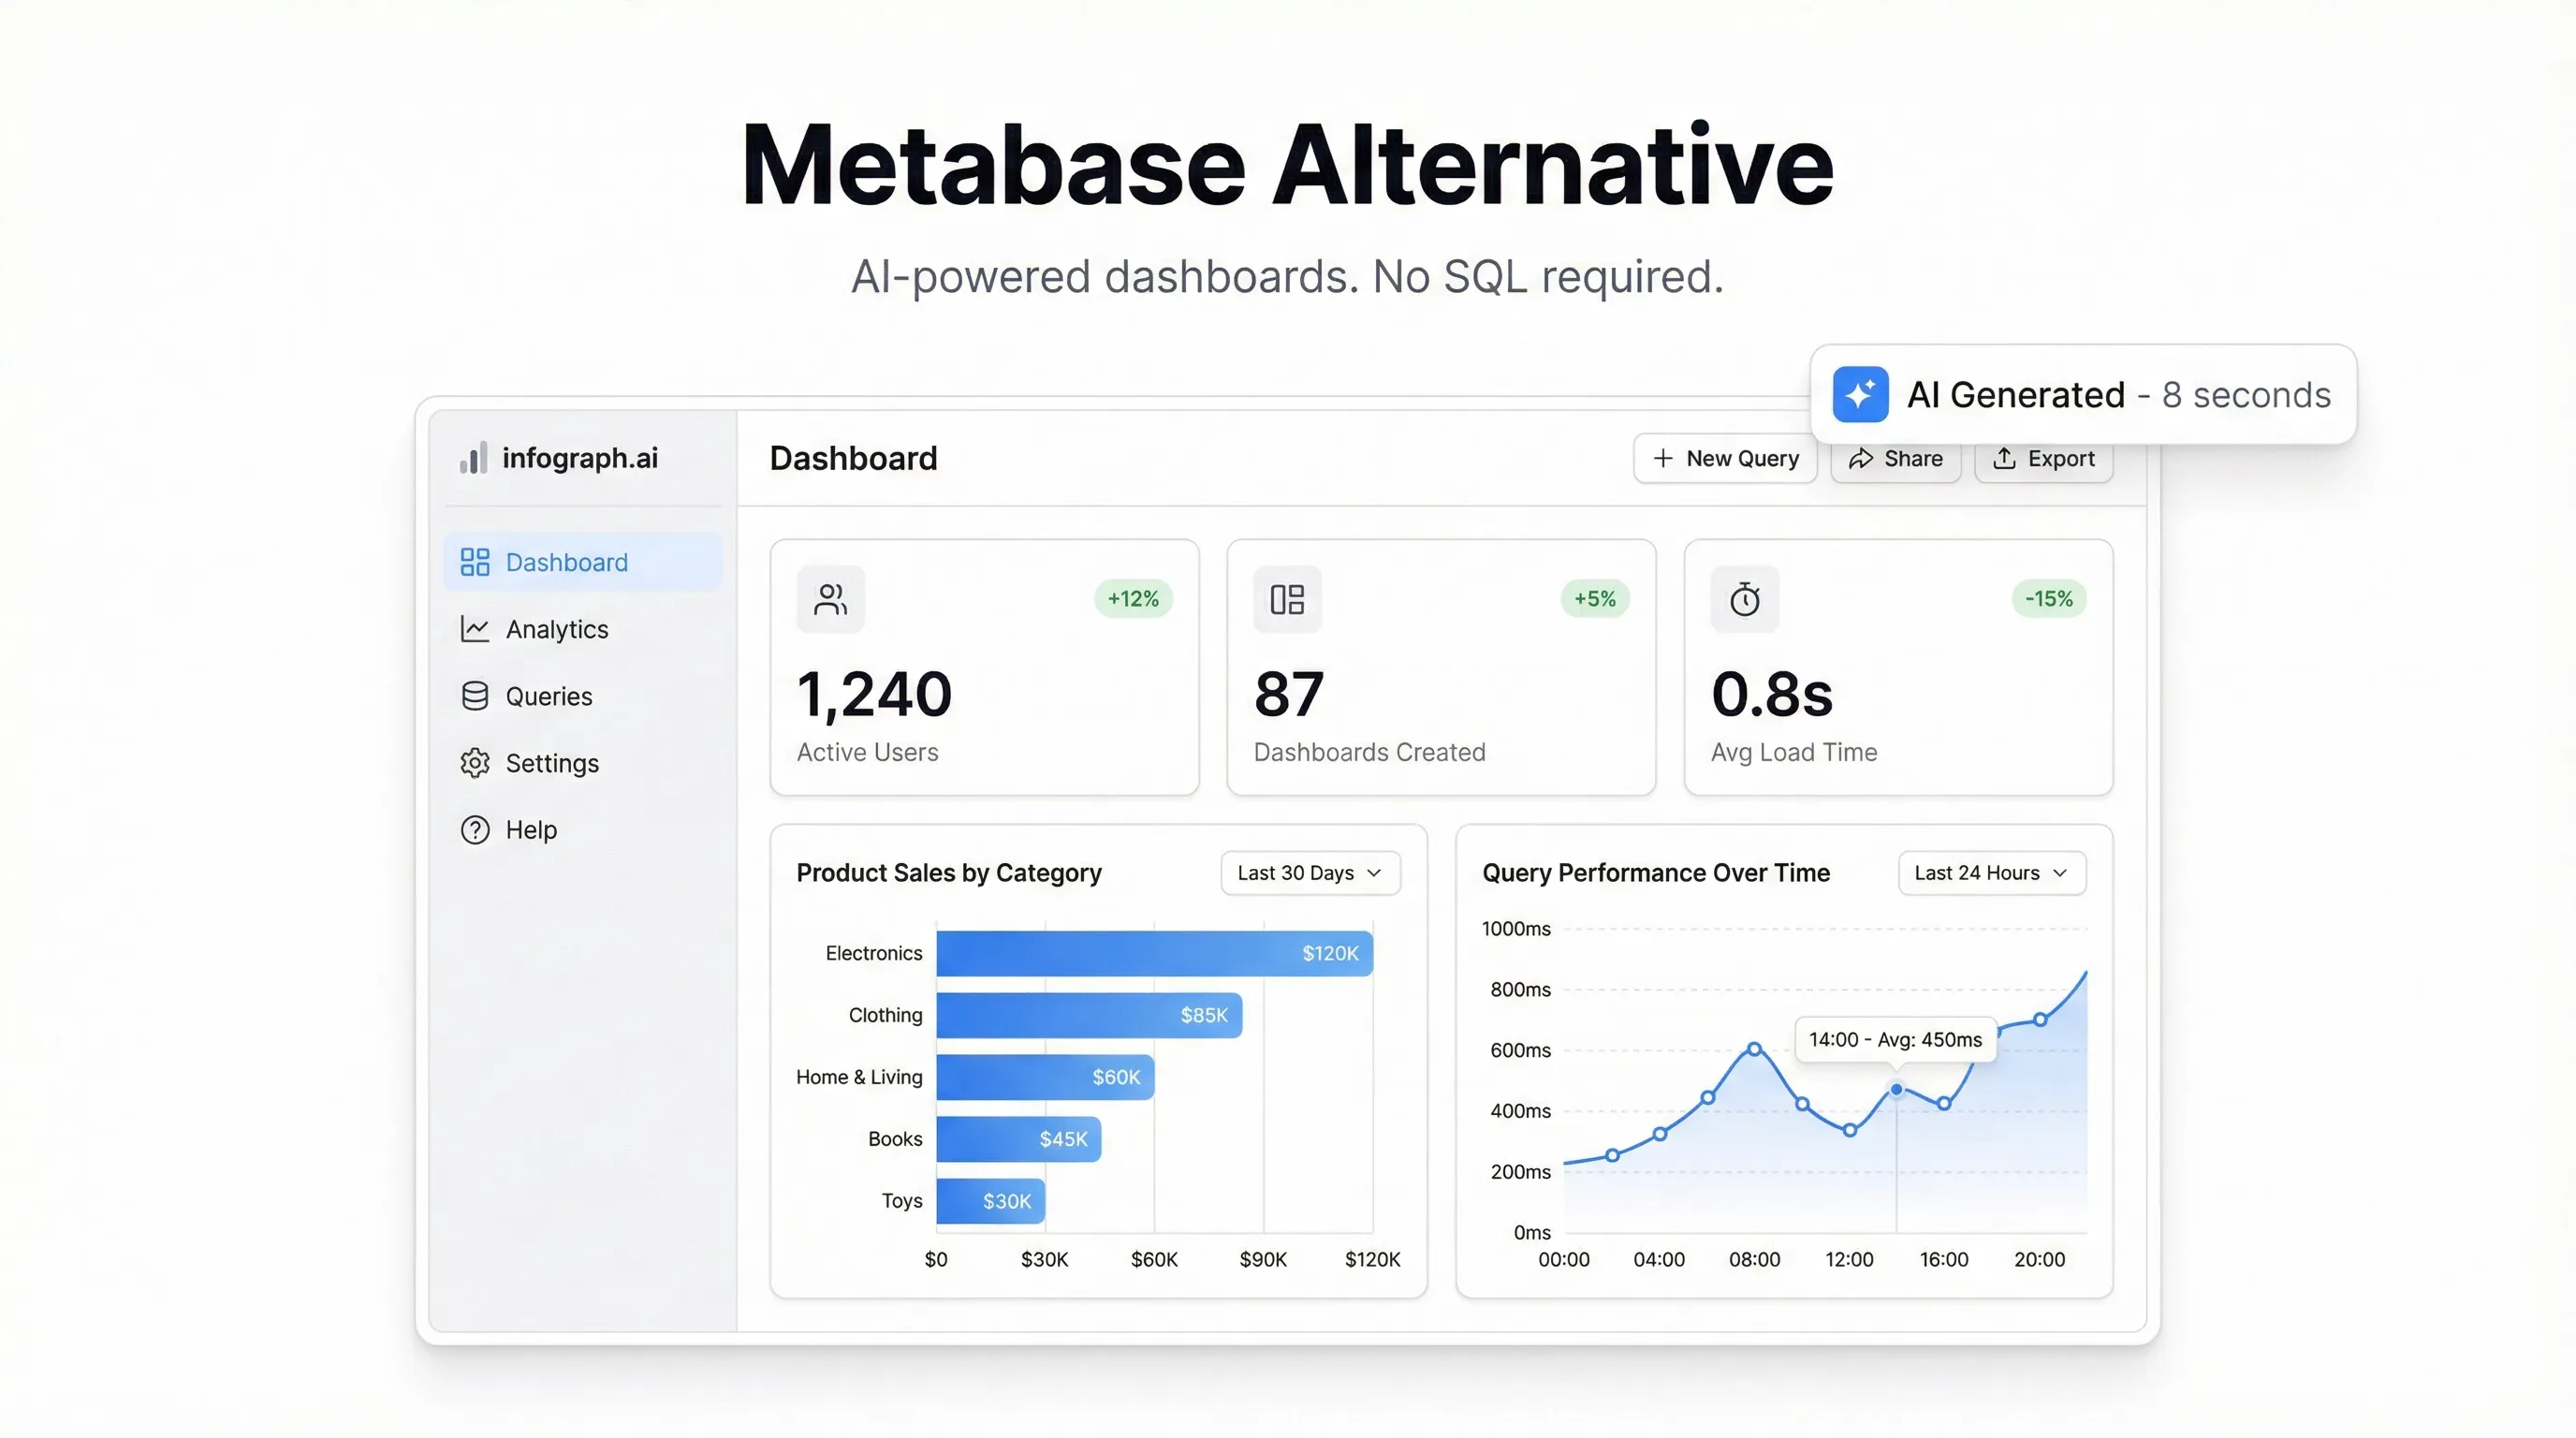
Metabase is powerful — but it requires hosting, maintenance, and an engineer who knows SQL. Here's an honest comparison of Metabase alternatives including Looker Studio, Power BI, Grafana, and Infograph.
Article
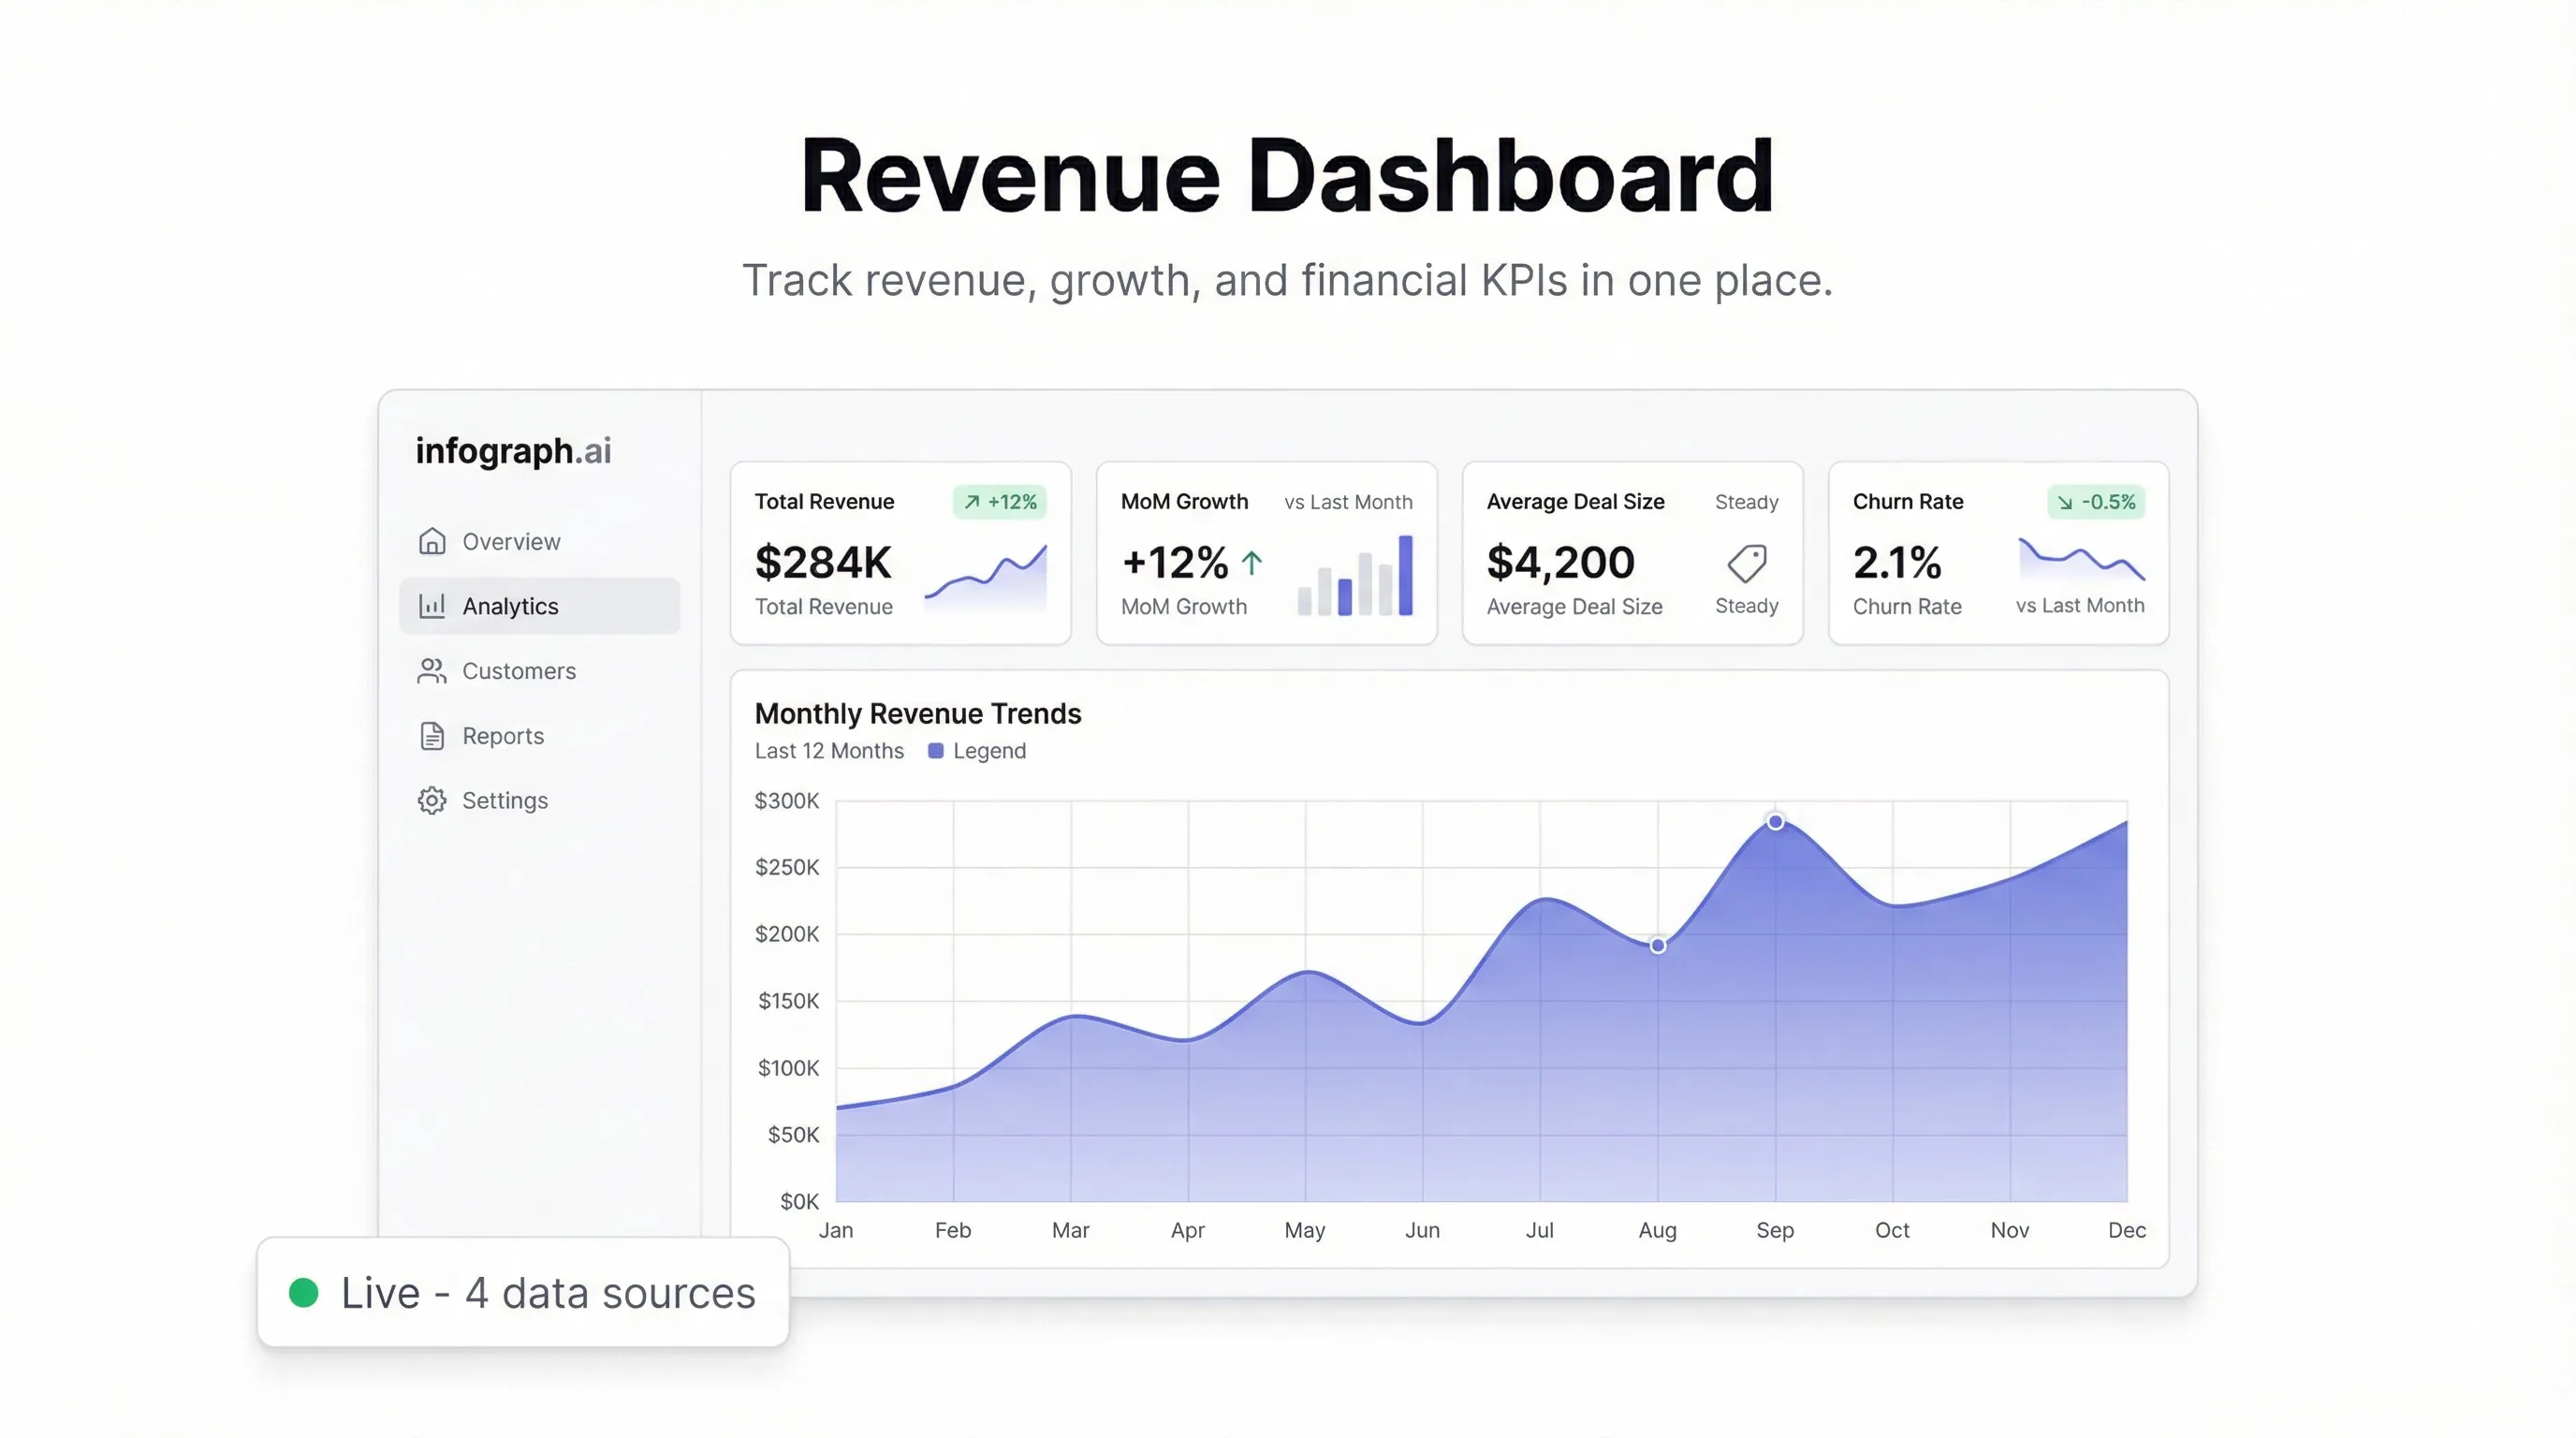
Build a live revenue dashboard that tracks MRR, ARR, revenue by channel, and growth rate from your Google Sheets or CSV data — in minutes, not weeks.
Article
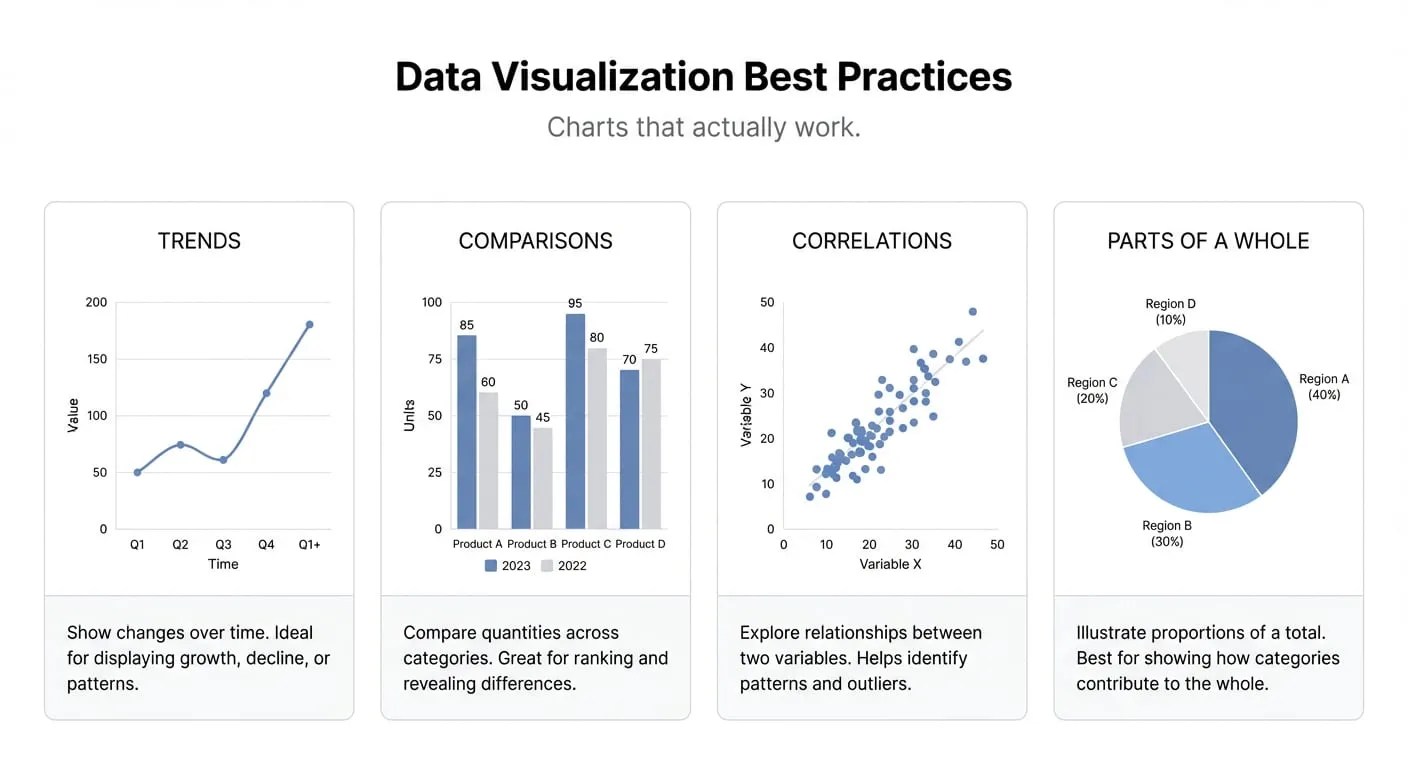
The data visualization best practices that make charts clear, honest, and useful — and the common mistakes that make them misleading or ignored.