Skip to content
← Latest posts

Blog page 3 of 8

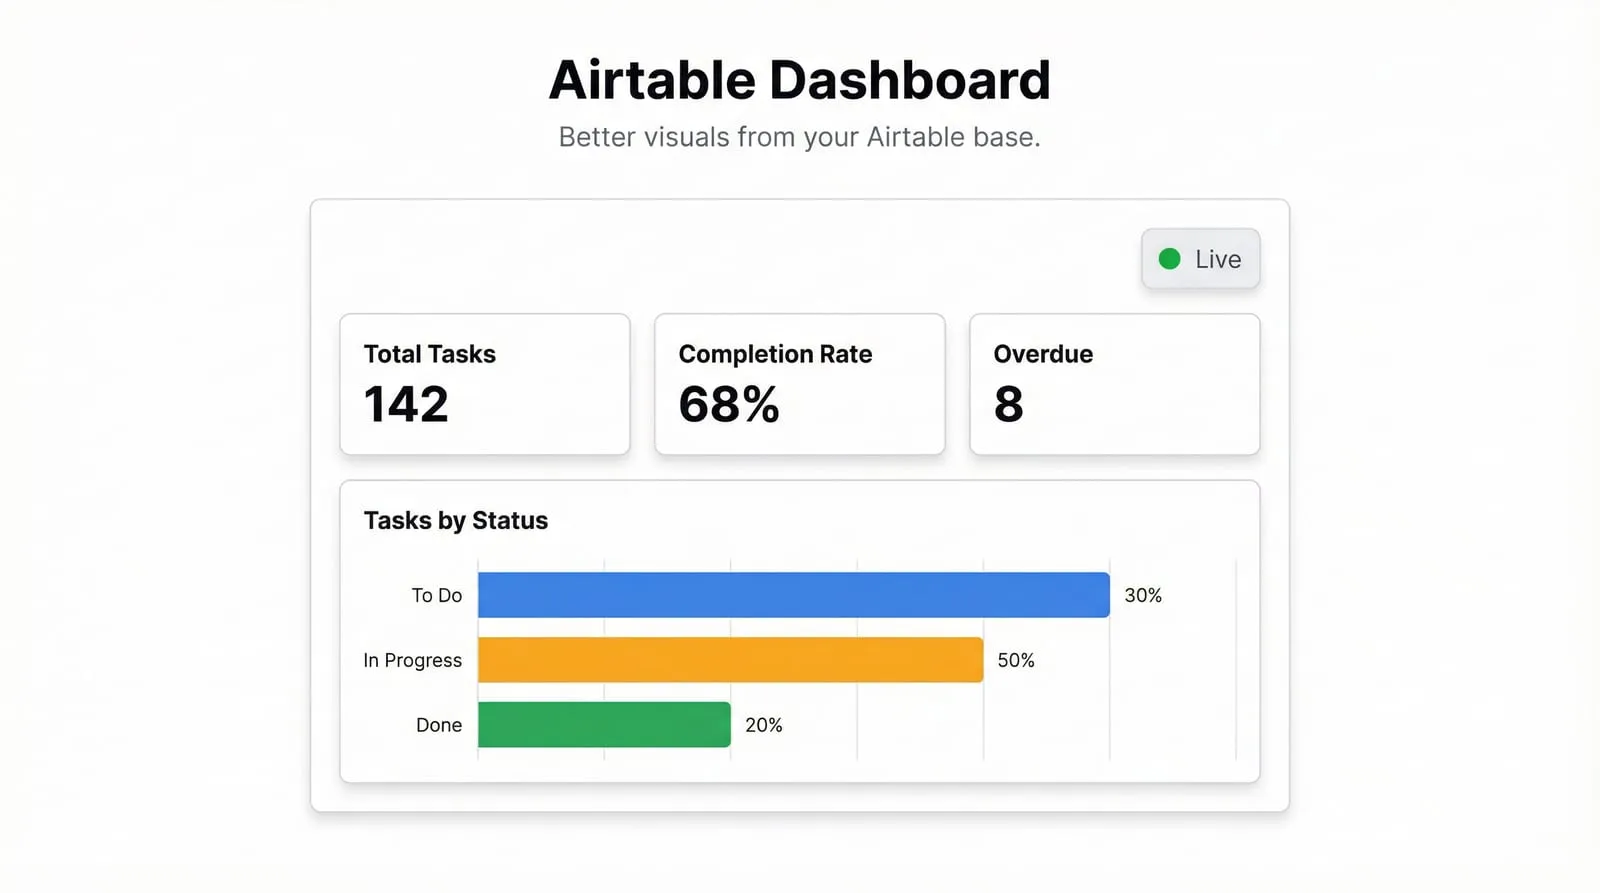
Airtable Dashboard: Build Better Visuals from Your Base
Guide

Airtable Dashboard: Build Better Visuals from Your Base

Airtable's built-in charts are limited — and the dashboard extensions can't do what you really need. Here's how to get better dashboards from your Airtable data, including a faster path using AI.
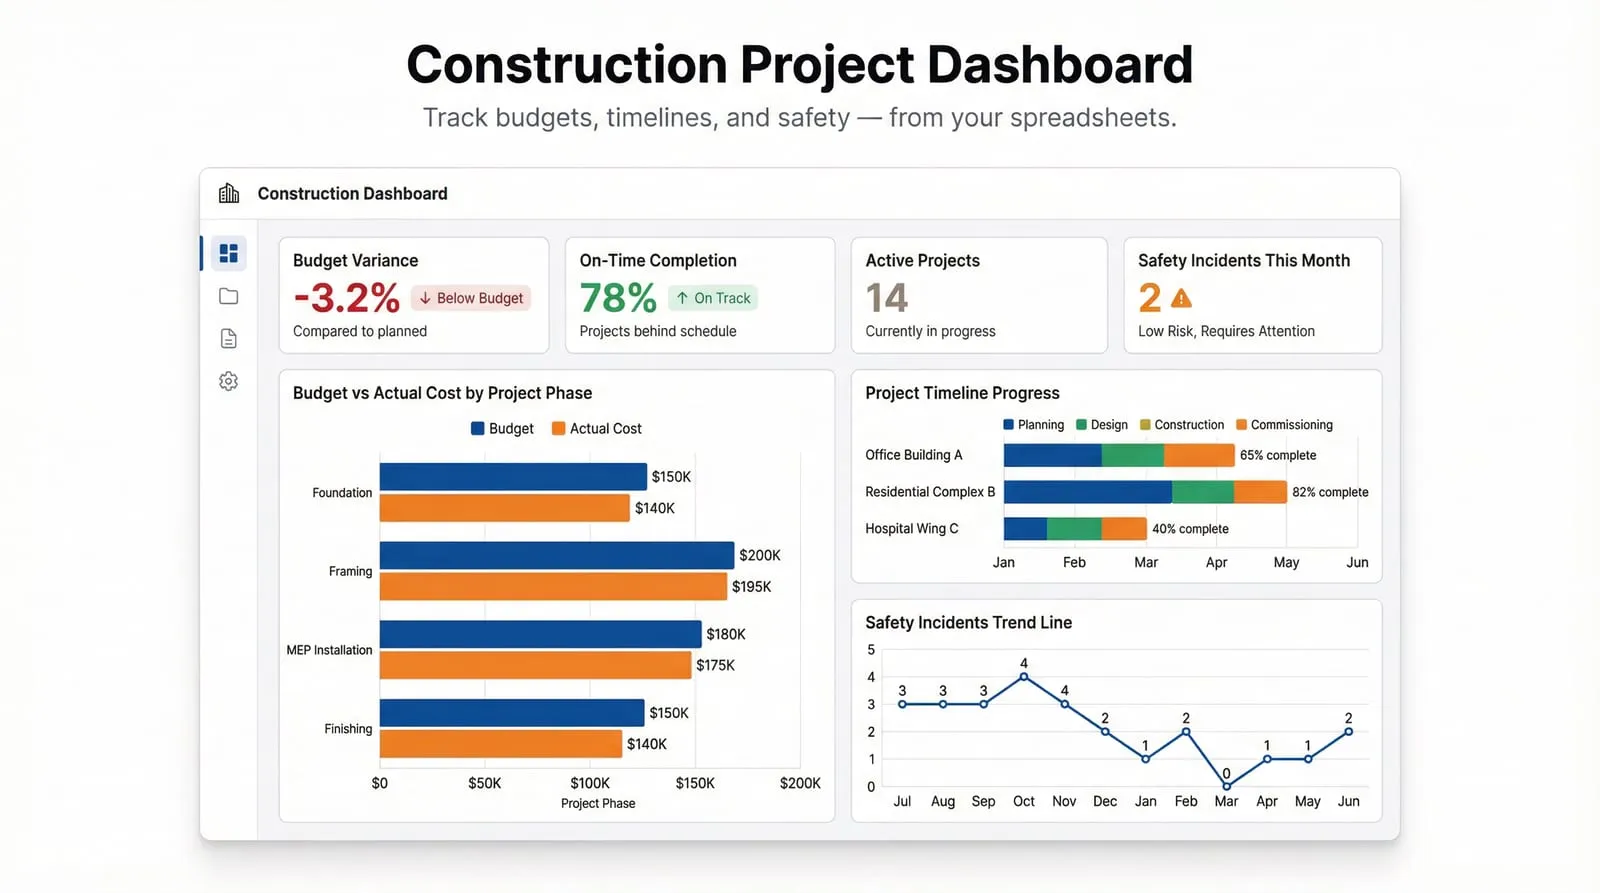
Construction Dashboard: Track Project Costs, Timelines, and Safety KPIs in One Place
Guide

Construction Dashboard: Track Project Costs, Timelines, and Safety KPIs in One Place

Build a construction analytics dashboard that tracks budget vs actuals, project completion, labor productivity, and safety metrics — from your existing spreadsheets.

Dashboard Sharing: How to Share Dashboards with Your Team and Clients
Guide

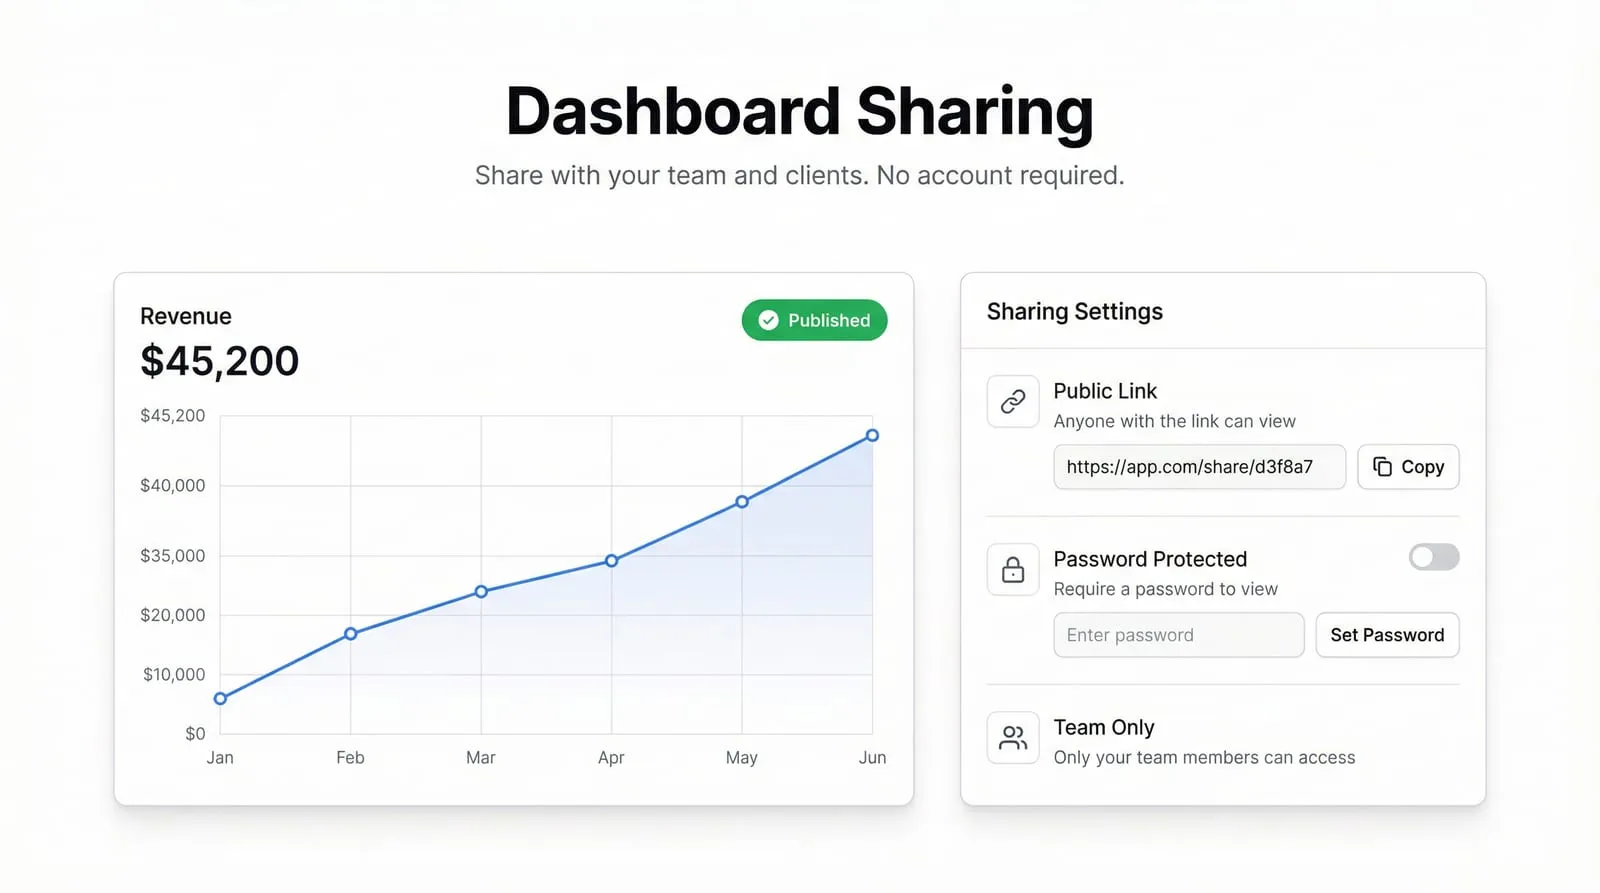
Dashboard Sharing: How to Share Dashboards with Your Team and Clients

Sharing a dashboard shouldn't require a meeting, a login, or a PDF attachment. Here's how to share dashboards properly — with your team, your clients, and the public — and what to look for in a tool that makes it easy.

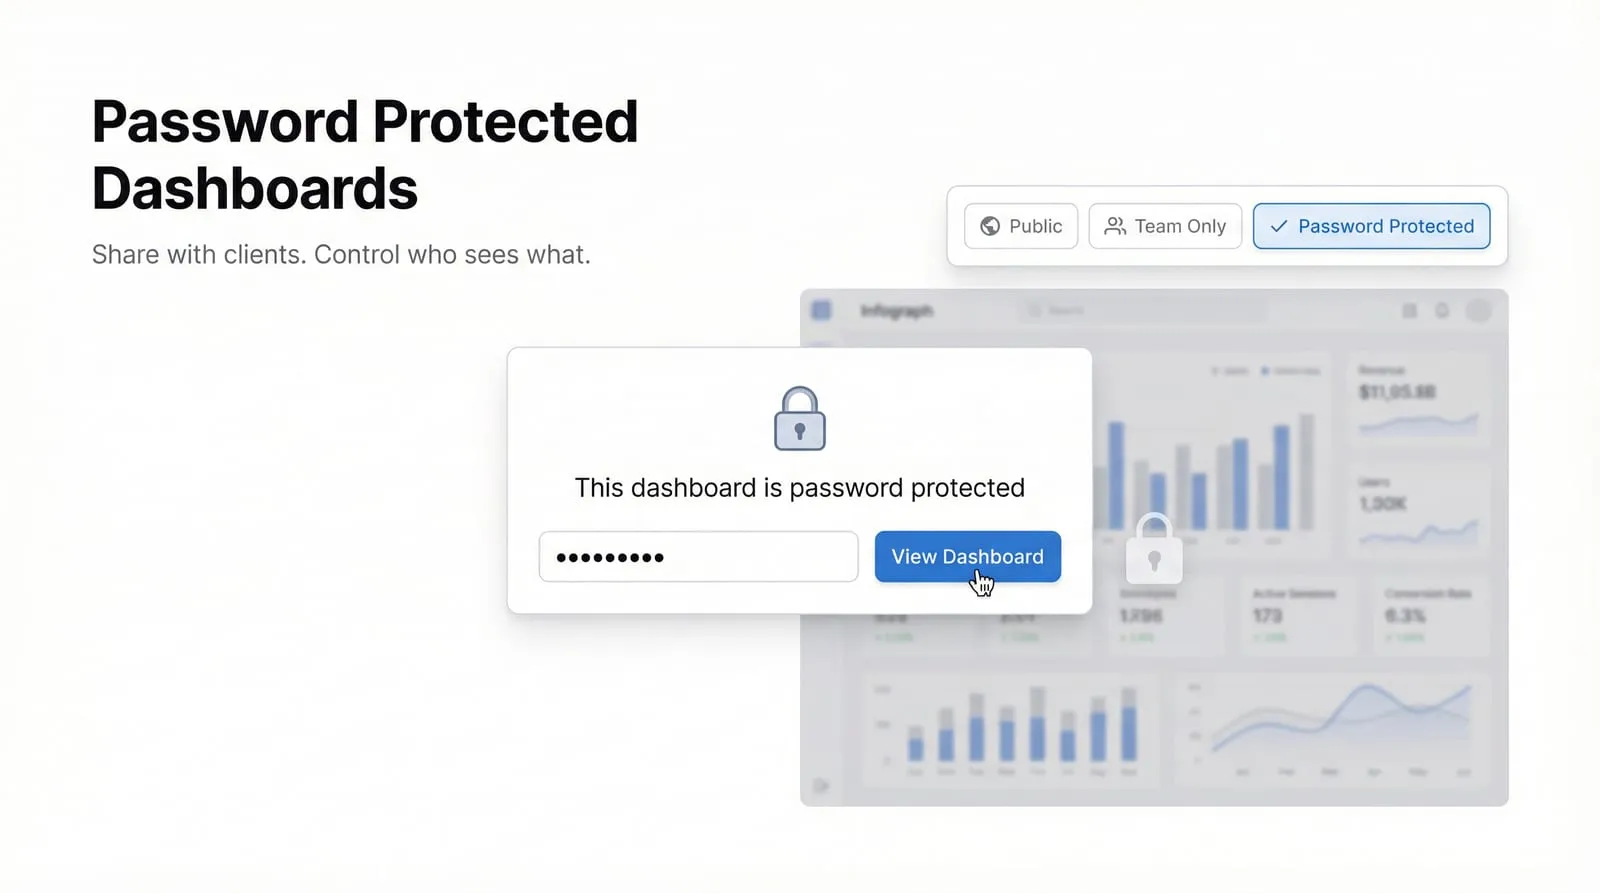
Password Protected Dashboard: Secure Sharing with Infograph
Feature

Password Protected Dashboard: Secure Sharing with Infograph

Share dashboards with clients or external stakeholders without making them public. Infograph's password-protected sharing lets you control who sees what — no account required on their end.

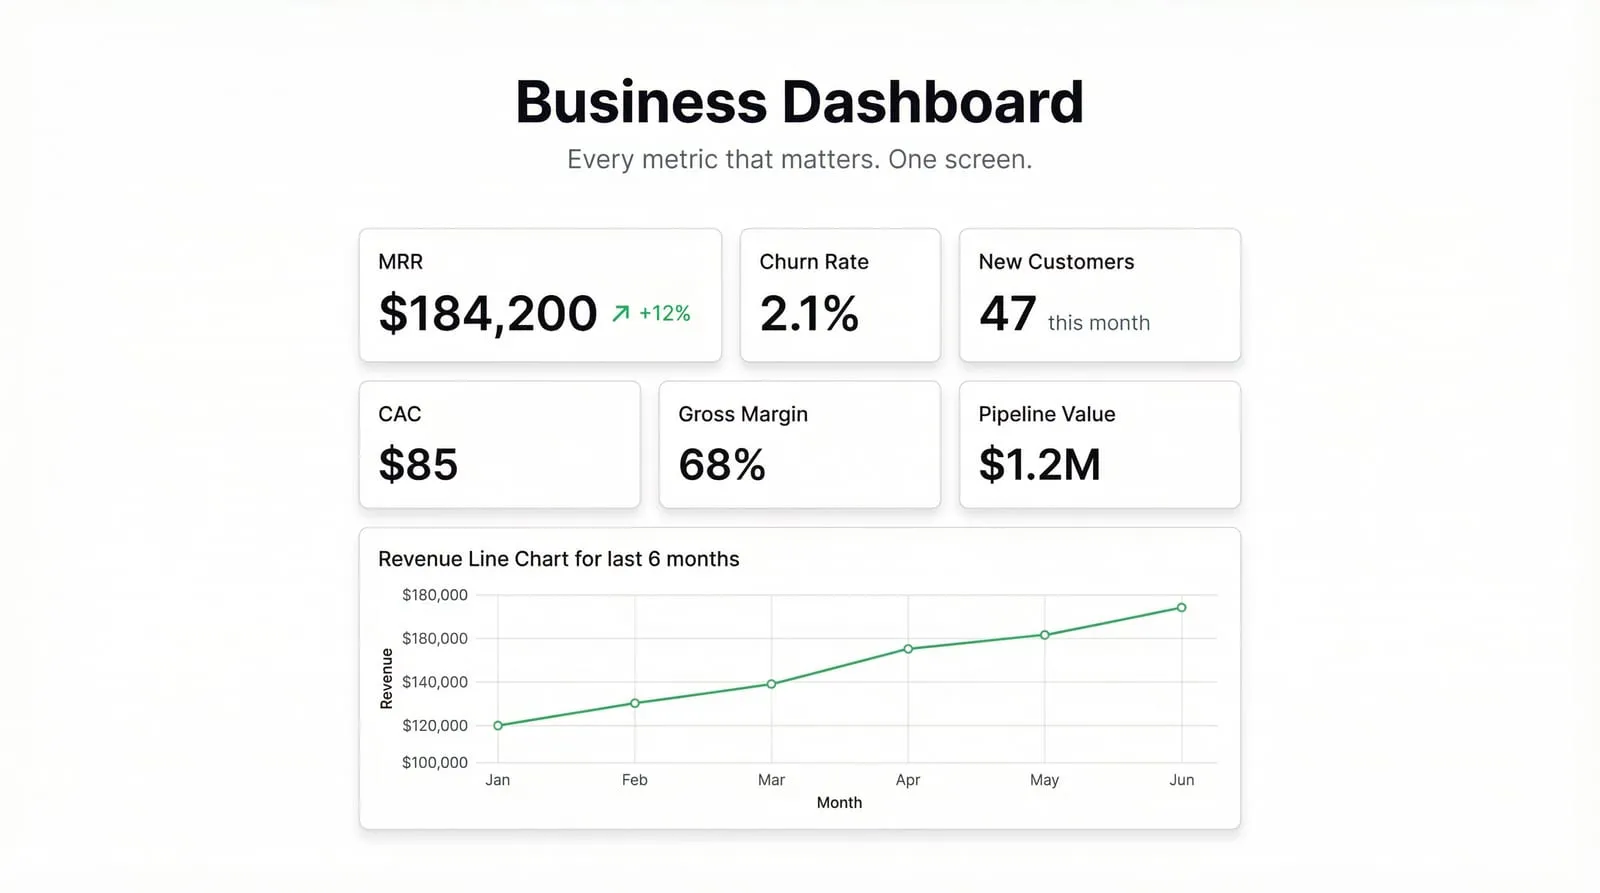
Business Dashboard: One Screen That Runs Your Entire Business
Guide

Business Dashboard: One Screen That Runs Your Entire Business

A business dashboard shows every key metric — revenue, operations, team performance — in one place. Here's what it should include and how to build one fast.

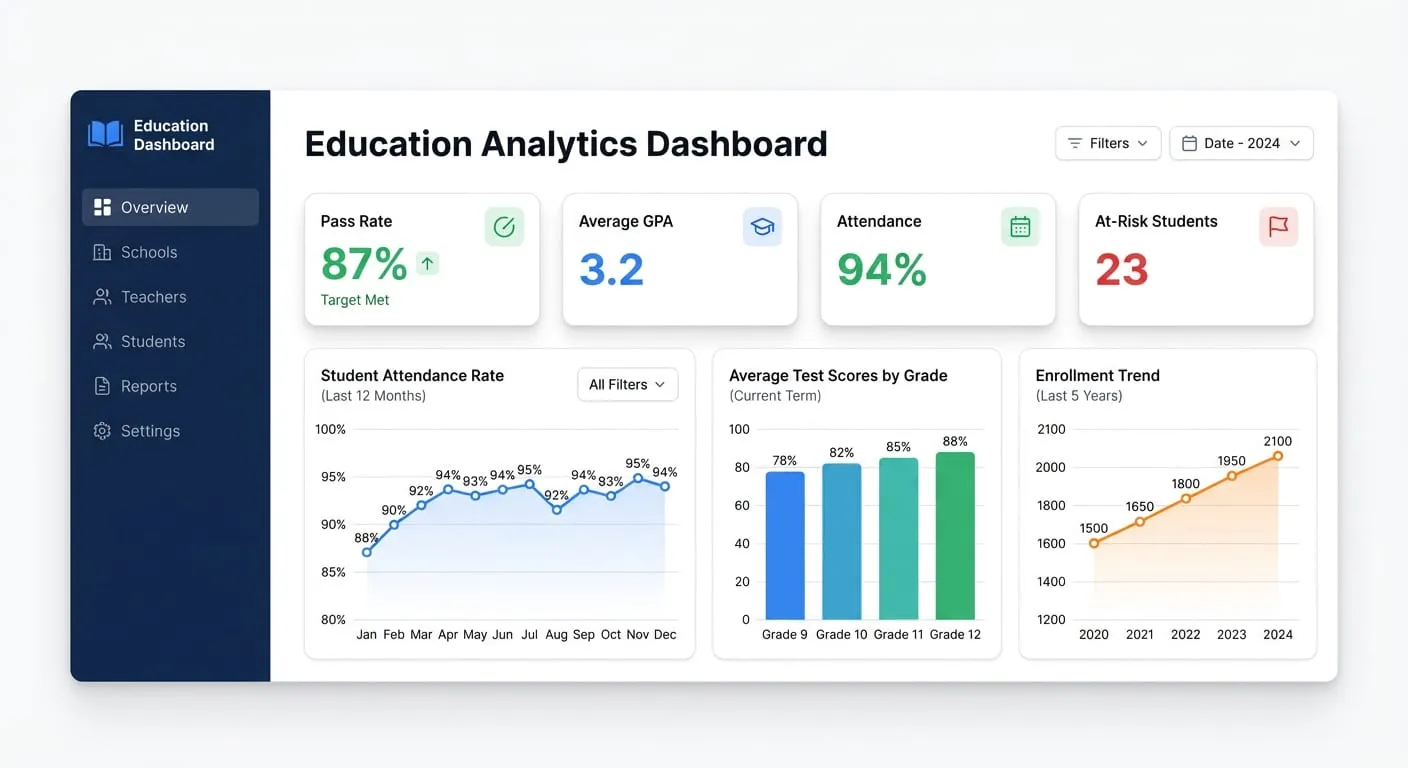
Education Dashboard: Track Student Performance and School KPIs Without a Data Team
Guide

Education Dashboard: Track Student Performance and School KPIs Without a Data Team

Build an education analytics dashboard that tracks student outcomes, attendance, and enrollment — from your existing spreadsheets, in minutes.

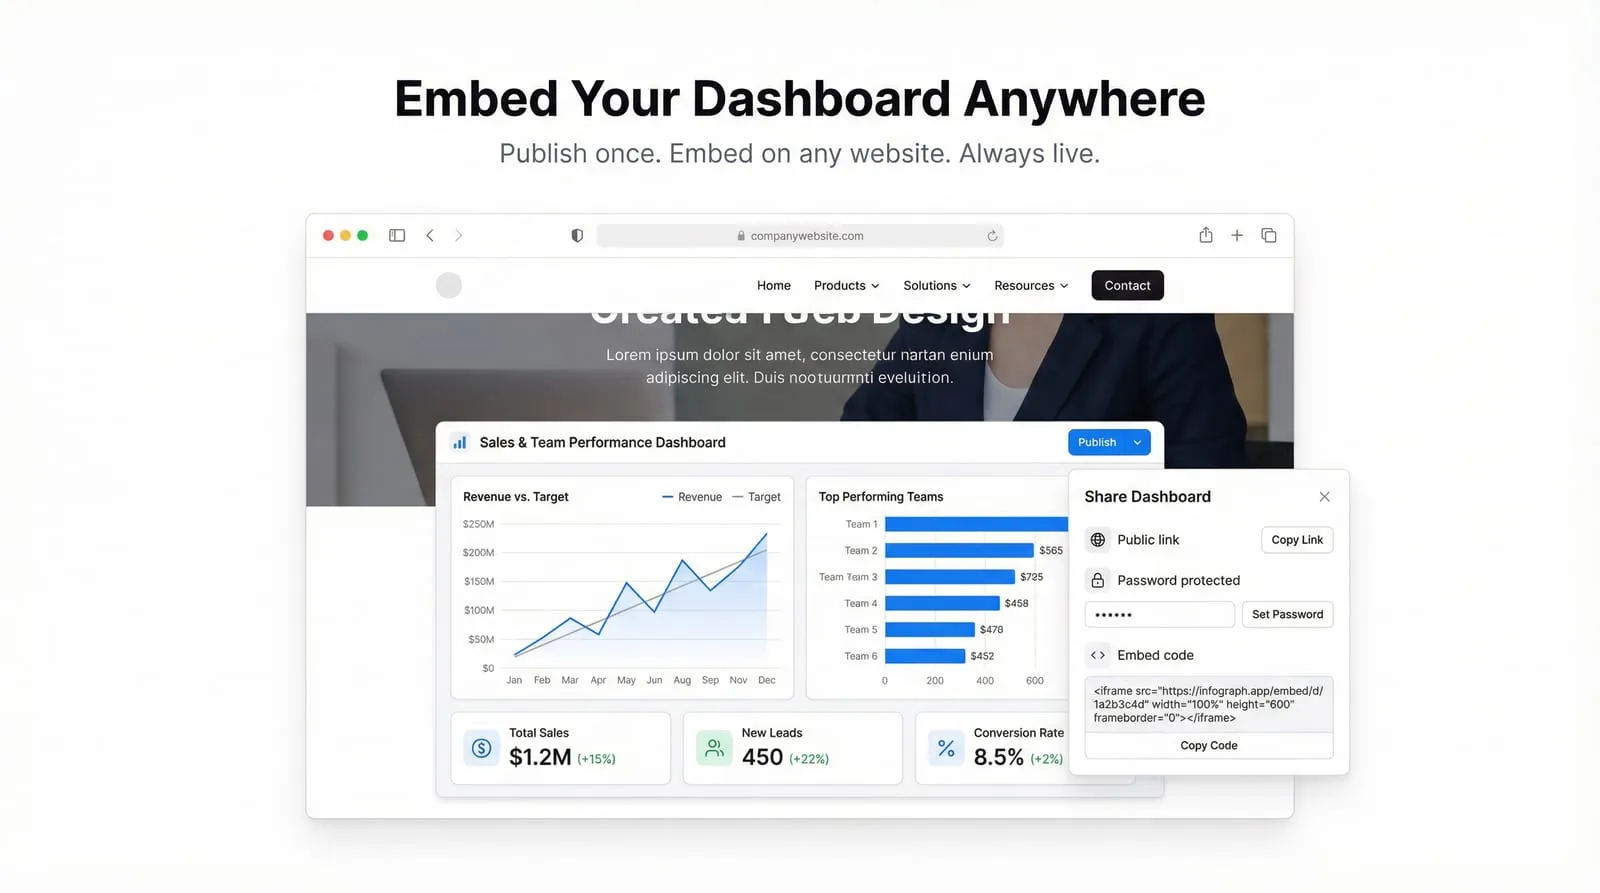
How to Embed a Dashboard on Your Website (Live, Interactive, No Code)
Feature

How to Embed a Dashboard on Your Website (Live, Interactive, No Code)

Infograph dashboards can be embedded anywhere — client portals, internal wikis, public pages. Here's how to publish and embed yours in under a minute.

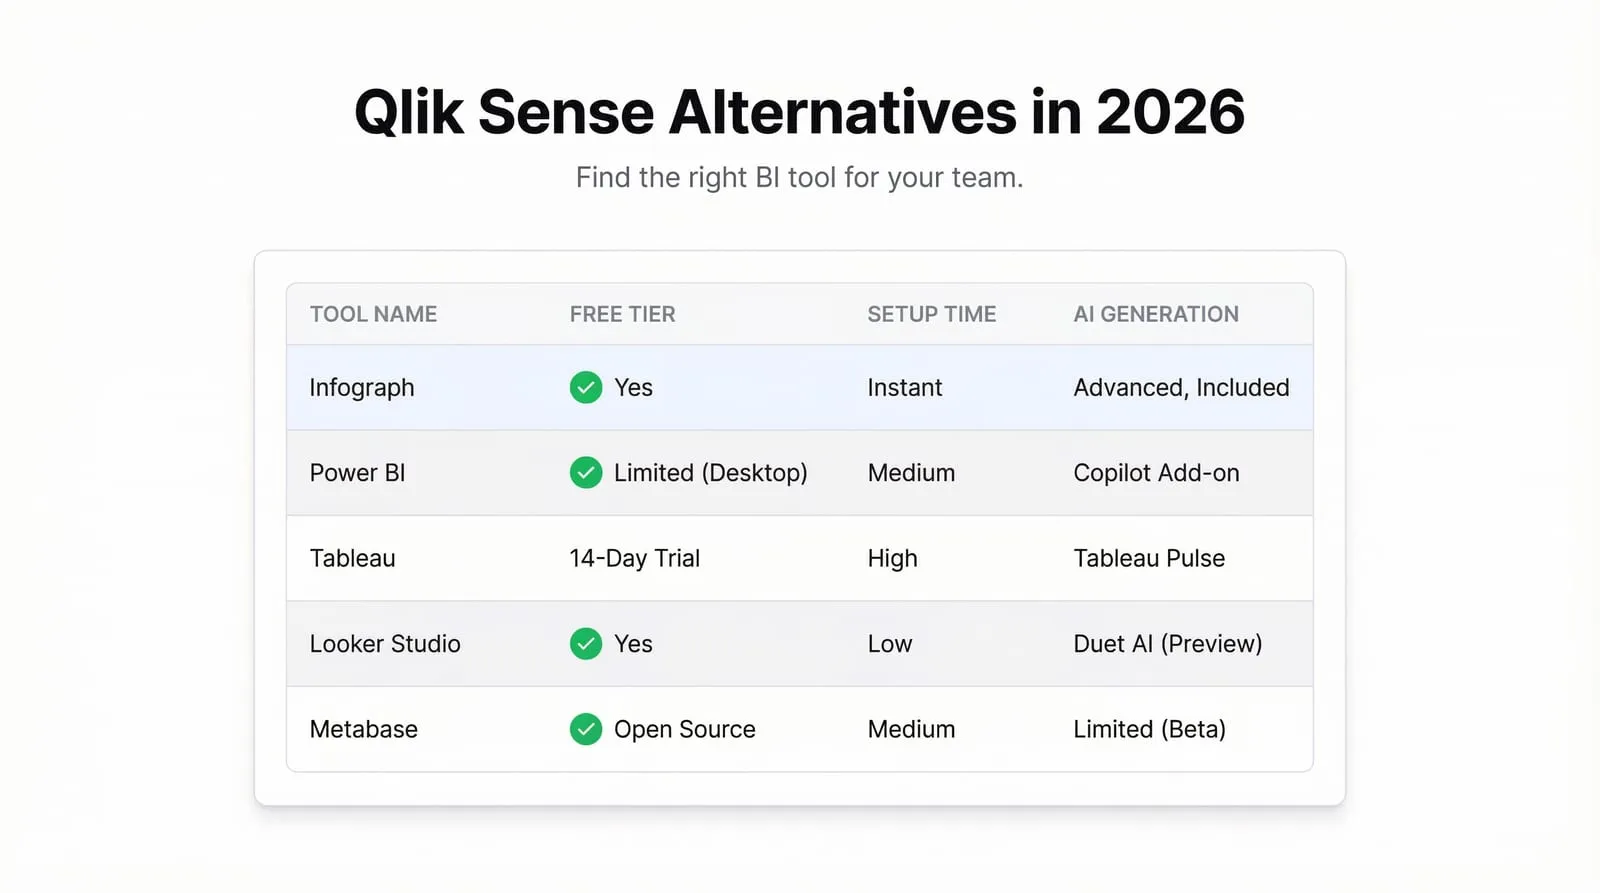
The Best Qlik Sense Alternative in 2026
Guide

The Best Qlik Sense Alternative in 2026

Qlik Sense is powerful — if you have the budget and the patience to learn it. Here are the best Qlik Sense alternatives in 2026, and when to actually switch.

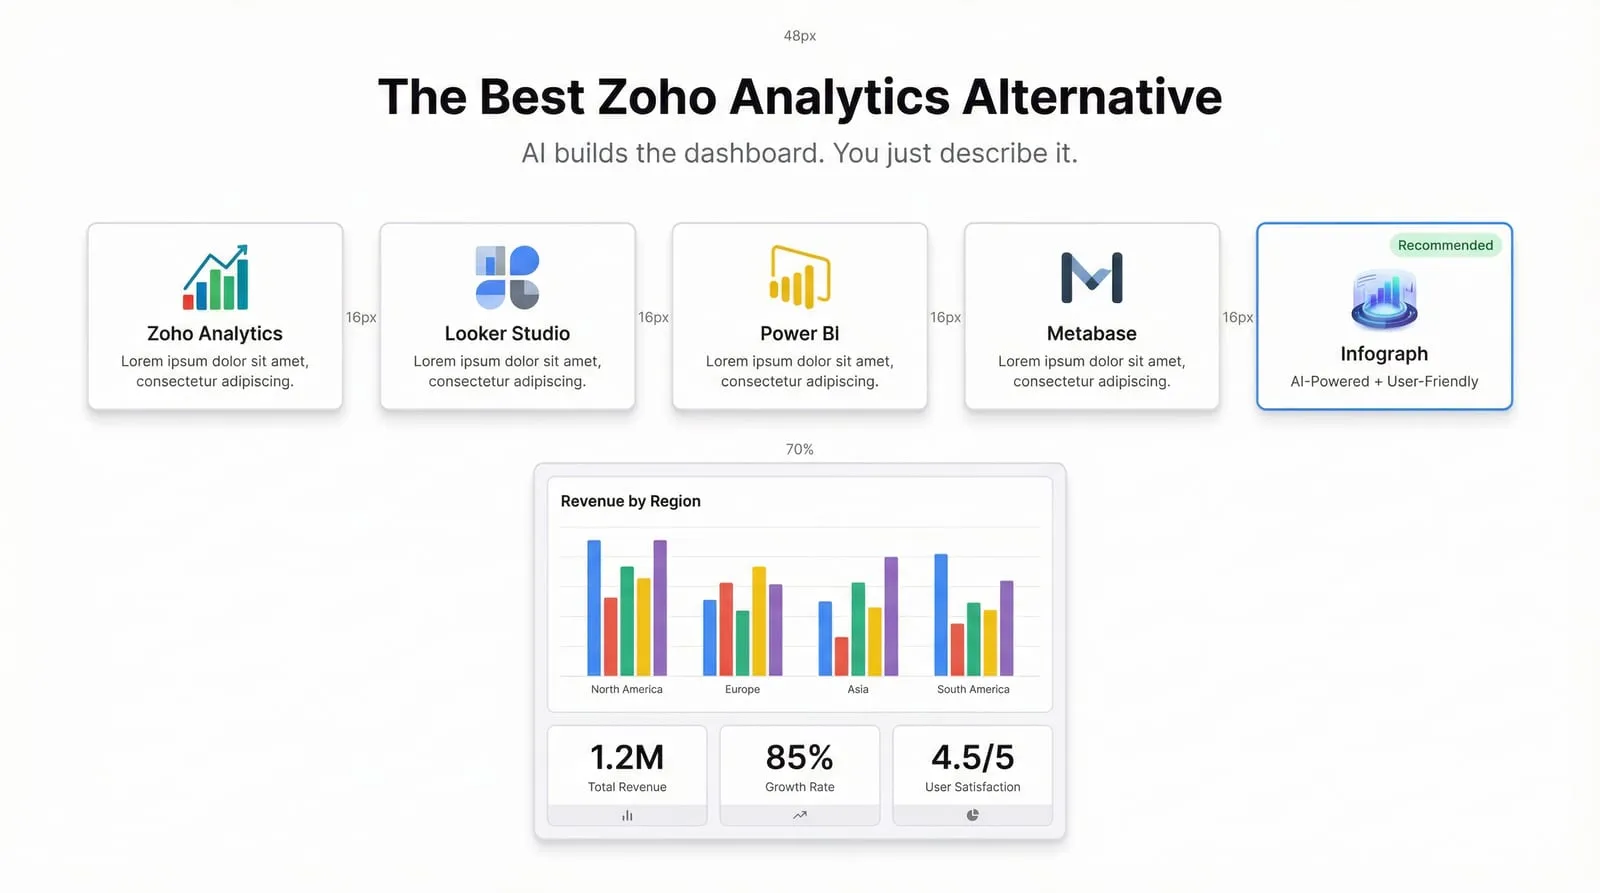
The Best Zoho Analytics Alternative in 2026
Guide

The Best Zoho Analytics Alternative in 2026

Zoho Analytics is affordable but frustrating to use. If you're hitting its limits — slow builders, rigid connectors, dated UI — here are the best alternatives, including one that builds dashboards from a single prompt.

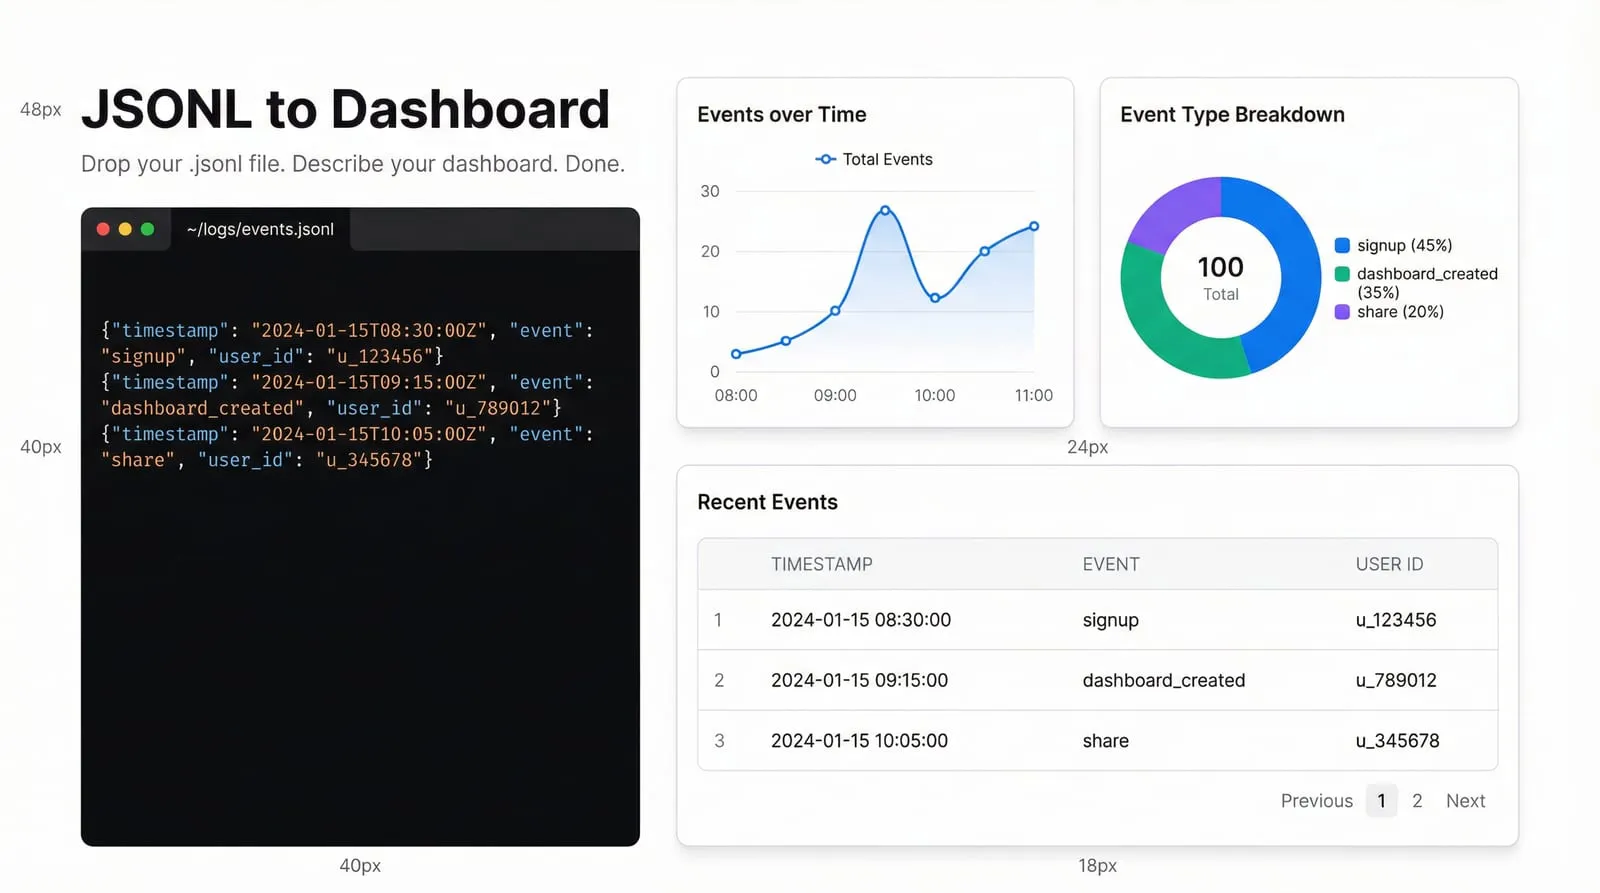
JSONL to Dashboard: Visualise Newline-Delimited JSON Instantly
Guide

JSONL to Dashboard: Visualise Newline-Delimited JSON Instantly

JSONL and NDJSON files are everywhere in data pipelines, logs, and AI outputs — but visualising them is a pain. Here's how to turn any JSONL file into a live dashboard without writing a line of code.

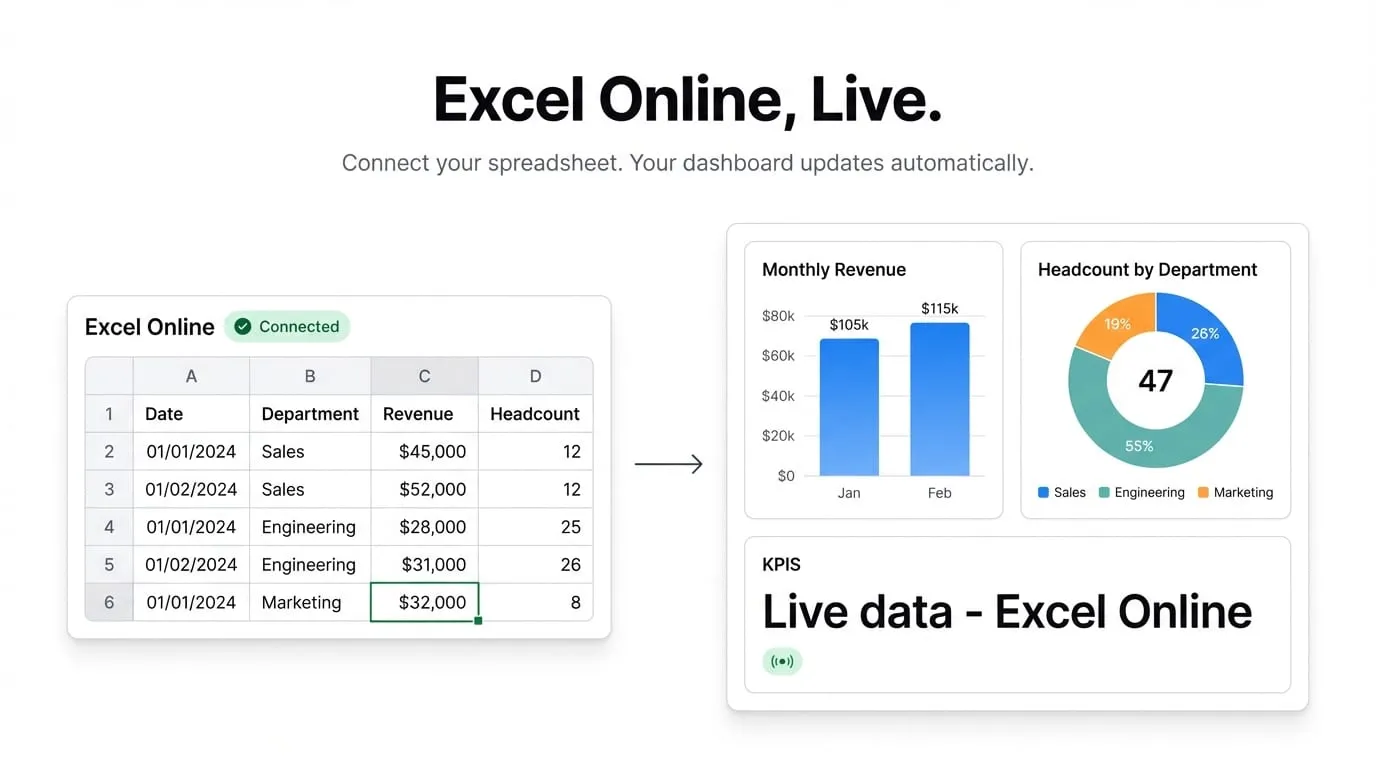
Microsoft Excel Online Dashboard: Live Data with Infograph
Feature

Microsoft Excel Online Dashboard: Live Data with Infograph

Connect your Microsoft Excel Online spreadsheets to Infograph and get a live, auto-updating dashboard — no exports, no copy-paste, no stale numbers.

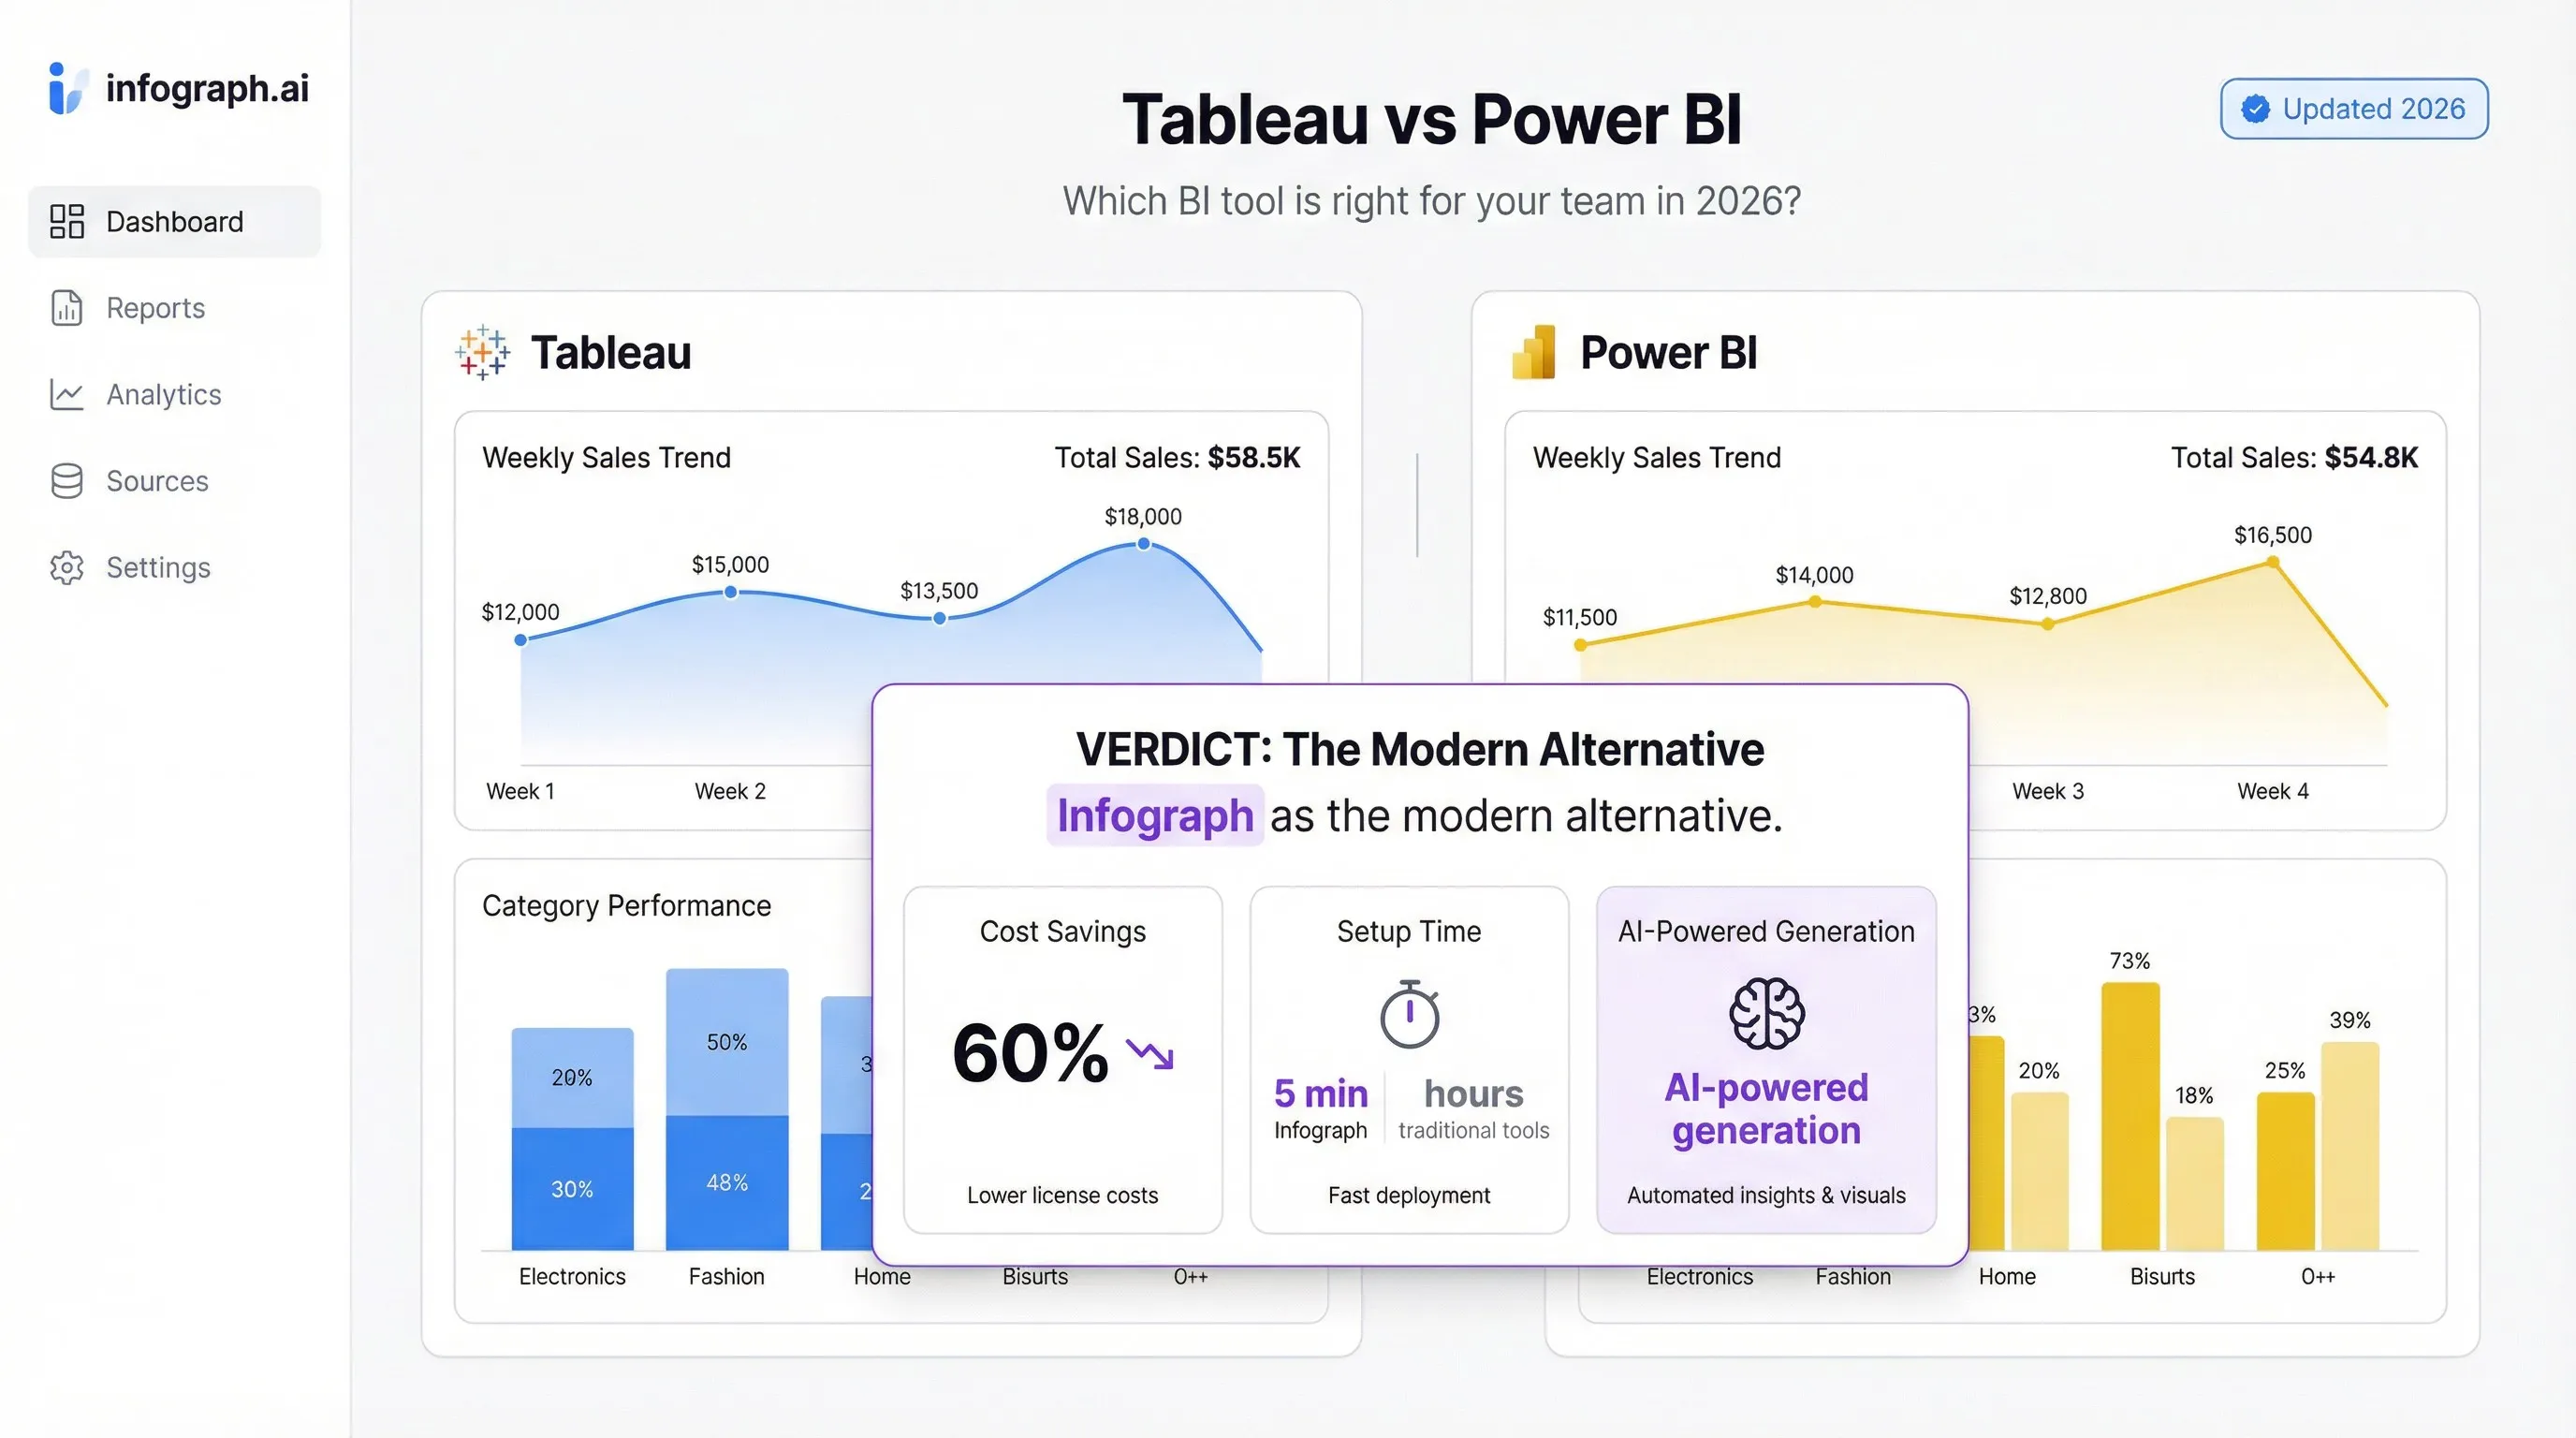
Tableau vs Power BI: Which Is Right for Your Team in 2026?
Comparison

Tableau vs Power BI: Which Is Right for Your Team in 2026?

An honest comparison of Tableau and Power BI in 2026 — pricing, learning curve, strengths, and when you should consider something else entirely.

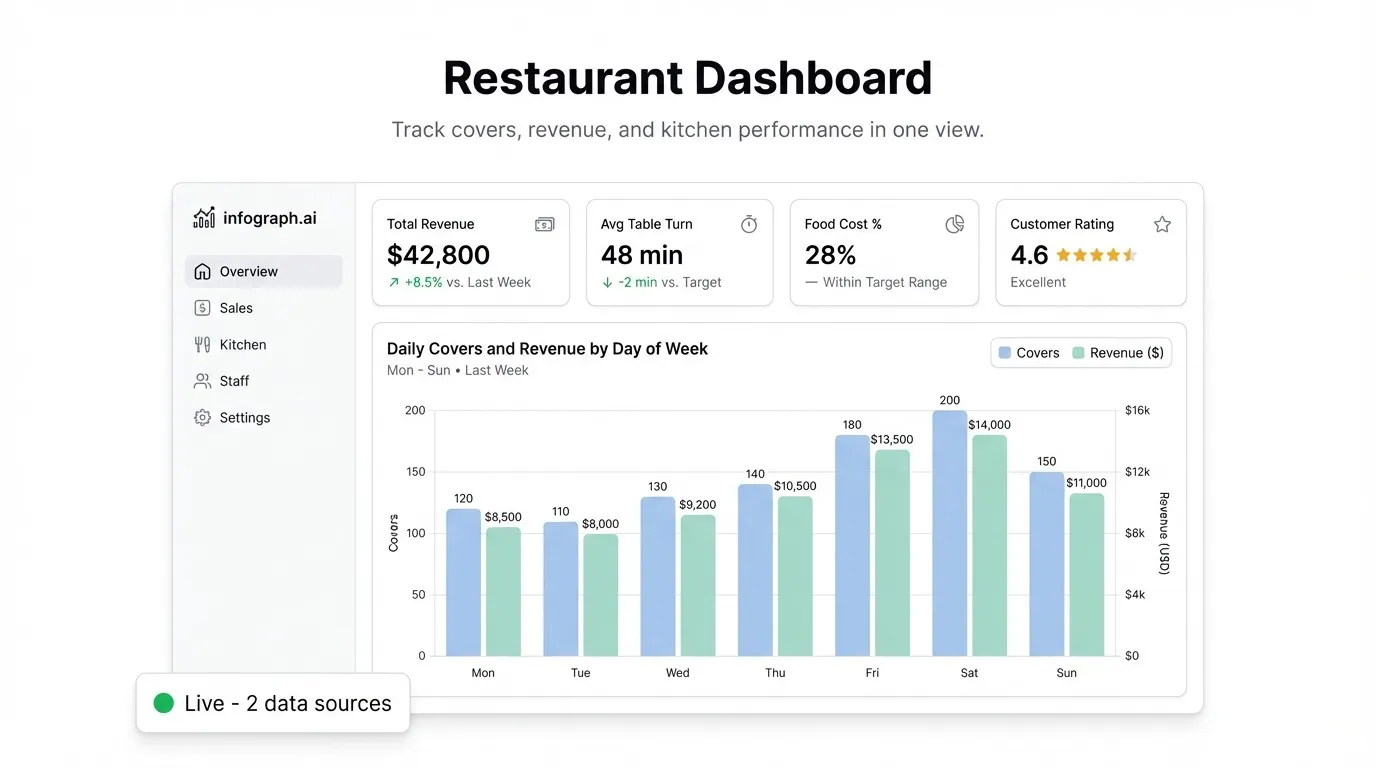
Restaurant Dashboard: Track Sales, Food Cost and Table Turns in Real Time
Guide

Restaurant Dashboard: Track Sales, Food Cost and Table Turns in Real Time

Learn how to build a restaurant dashboard that tracks daily revenue, food cost %, labor cost %, covers per hour, and top-selling items — using your existing POS exports.