Loved by Developers Built with Infograph
Jira Dashboard: Cycle Time, Time in Status and Where Work Waits
A Jira dashboard for cycle time and time in status, built from Jira's own change history: see where tickets wait and which are stuck right now.
Highlights
Every ticket in progress, placed by its age
A card climbs as its ticket gets older, so the oldest work sits at the top of its column and you can see at once which column it's stuck in.
A red line for slower than usual
85% of your recently finished tickets took less time than this, so the line moves with your own history. The cards above it are the ones to ask about at standup.
Cycle time: the typical ticket and the slow ones
Half of the tickets finished in the last 90 days took under 8.1 days, and 85% under 16.0. Both have risen since the 90 days before: the median by 1.1 days, the 85th percentile by 2.9.
Key takeaways
- See how much of the cycle is waiting. In our sample team’s data, 59% of the time between starting and finishing a ticket went on review and QA queues. In Review alone took 44%, more than building did.
- Spot what’s stuck right now. 11 of the 40 tickets on the board are older than 16 days, longer than 85% of finished tickets took. 7 of them sit in In Review.
- Check whether more work in progress slows you down. Over the last 13 weeks, a typical week began with 33 tickets started but not yet done, against 22 a year earlier. About the same number finished each week, and they took longer to finish.
Made with Infograph
Connected the data
Built the dashboard
Turned two years of Jira status changes into cycle time, time in status and a board of what's stuck
Shared with your team
Send a link, or work on it together in your account
Connect your apps and databases. Infograph builds live, interactive dashboards for you and your team.
No credit card required
A Jira dashboard is one page that shows how work moves across your team’s board. This one shows how long that work takes. Cycle time is the days from starting a ticket to finishing it. Time in status splits those days by status, so you can see how long tickets sit In Progress, In Review or waiting for QA.
Jira records every status change on every ticket, but its reports don’t easily answer two questions: what’s stuck right now, and where do the days go? The Control Chart shows one dot per finished ticket. The Average Time in Status gadget averages one status at a time. Neither shows which open tickets have waited longest. Our guide to time in status compares every way to get these numbers out of Jira.
We built this dashboard in Infograph, where you connect apps like Jira and ask for dashboards in plain words. It reads the change history and works out how long each ticket spent in each status.
We walk through it with Rotaloom, a made-up company of 28 people that makes staff scheduling software for restaurants. Its three teams run their work in Jira: a web app team and a platform team on two-week sprints, and a mobile team on kanban. The tickets are sample data, in the same shape Infograph syncs from a real Jira site. Connect your own site and you can build the same panels on your own tickets. Open the sample dashboard to click through it as you read.
- How long the longest-waiting ticket has been sitting In Review
- 37.7 days
- Source: This dashboard, at the last sync
- Median time a ticket spends In Review, up from 2.1 days in the 90 days before
- 3.0 days
- Source: This dashboard, last 90 days
What the Jira dashboard reads
Everything comes from one Jira connection, and nothing is exported or typed in. The one thing you tell it is which of your statuses mean a ticket is waiting on someone, such as In Review. Jira can’t know that for you.
Jira. Every issue updated in the last two years, each with its full change history: every move between statuses and when it happened. The status list says how Jira groups your statuses into To Do, In Progress and Done, and projects and versions give the names of your teams and releases. How to connect Jira.
One Infograph dashboard, updated each time Jira syncs.
How to read your Jira dashboard
The controls at the top filter by project and issue type, and switch between the last 30, 90 and 180 days.
Find what’s stuck on the aging board
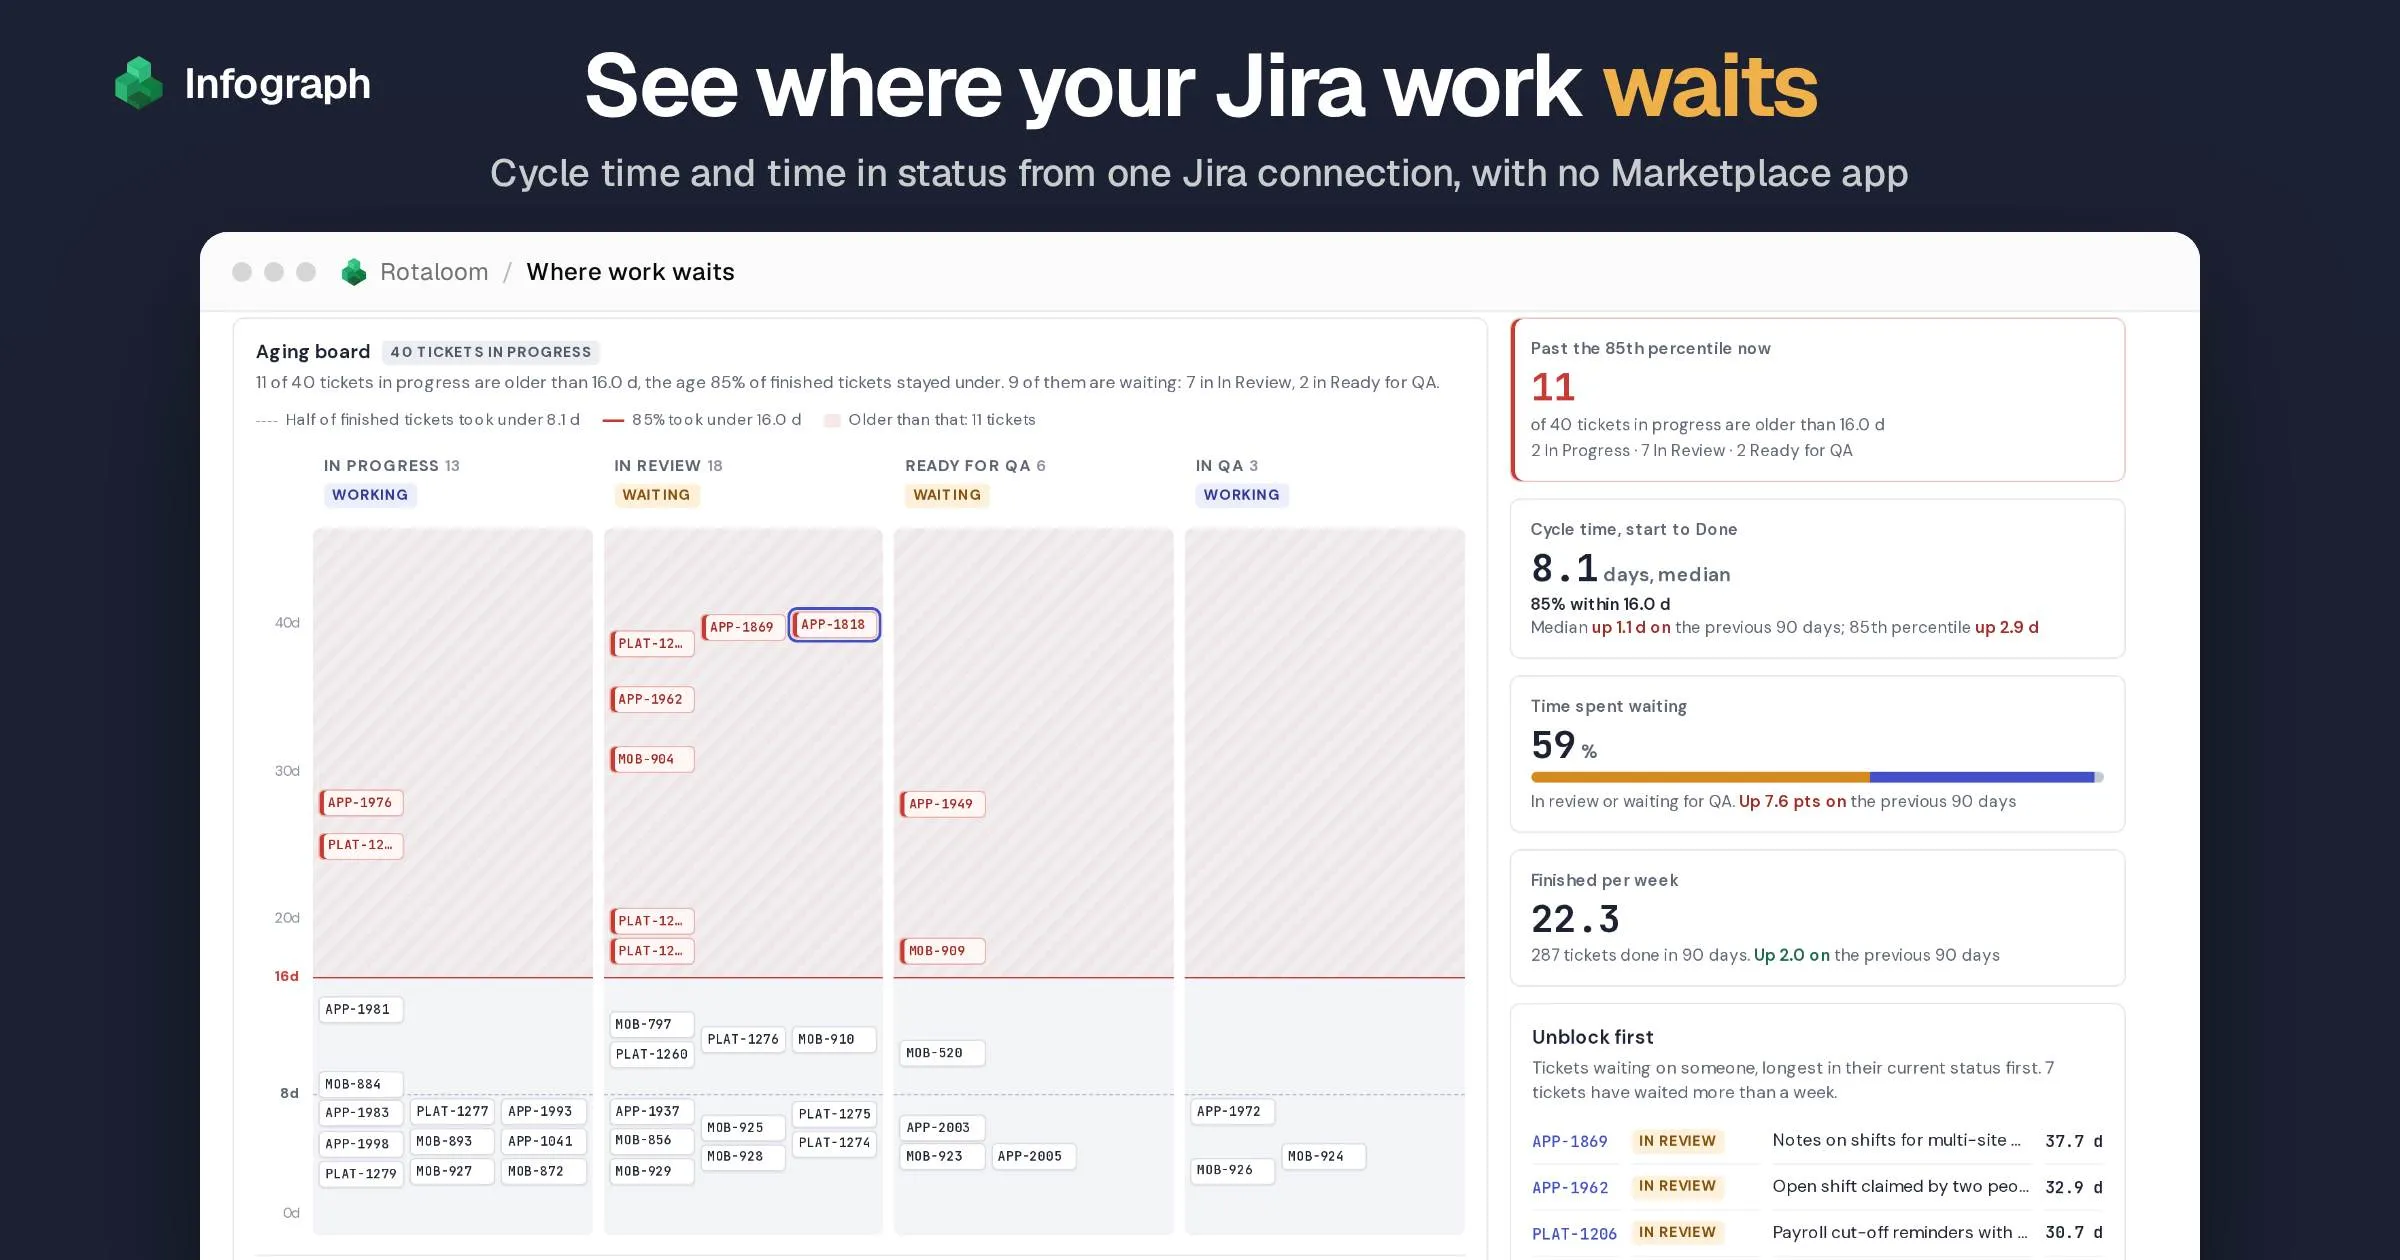
The board has the columns your team already uses: In Progress, In Review, Ready for QA, In QA. What’s new is the height of each card: it sits at the number of days since work on the ticket started. The older the ticket, the higher its card. Together the four columns hold every ticket in progress: started, but not yet done.
Two lines cross every column. The dashed one is the median: half of the tickets finished in the last 90 days took less time than that. The red one is the 85th percentile: 85% of those tickets took less time than that. Kanban teams often use it as the line for “slower than usual”. Above it, cards turn red. These tickets are now taking longer than 85% of what your team finished recently.
At Rotaloom, 11 of the 40 tickets on the board are above the red line, at 16 days. Nine of those 11 are waiting rather than being worked on: seven in In Review and two in Ready for QA.
In Review is also the fullest column, with 18 tickets, more than In Progress has.
So on a Monday, look first at which column the old cards are in. If they’re in a waiting column, they need someone to review or test them, and starting new work won’t move them.
Open a ticket to see where its days went
Click any card and its timeline opens under the board, from the day work started to now. Working statuses are indigo and waiting ones are amber.
APP-1818 is one of the oldest. Building it took 12.2 days. It has been waiting for review for 27.7 more, which is 70% of its time since work started. Counted from the day someone wrote it, it is 136 days old: that’s its lead time. It has also been carried over two sprints, which Jira doesn’t show on the board.
Check cycle time, and how much of it is waiting
The tiles beside the board sum up the period. Rotaloom’s median cycle time over the last 90 days is 8.1 days, and 85% of tickets finished within 16.0. Both have gone up since the 90 days before: the median by 1.1 days and the 85th percentile by 2.9.
The tile to watch is time spent waiting. Of all the days between starting and finishing, 59% were spent in In Review or Ready for QA, waiting on someone else. In the 90 days before, it was 52%.
Under the tiles is a list called Unblock first. It ranks the waiting tickets by how long they’ve sat in the status they’re in now, rather than since work started. So APP-1818, the oldest ticket on the board, only comes fifth: it spent its first 12 days being built, and has been in review for 27.7. The top one, APP-1869, has been in review for 37.7 days. Read the list out at standup, top first.
See where the days go, status by status
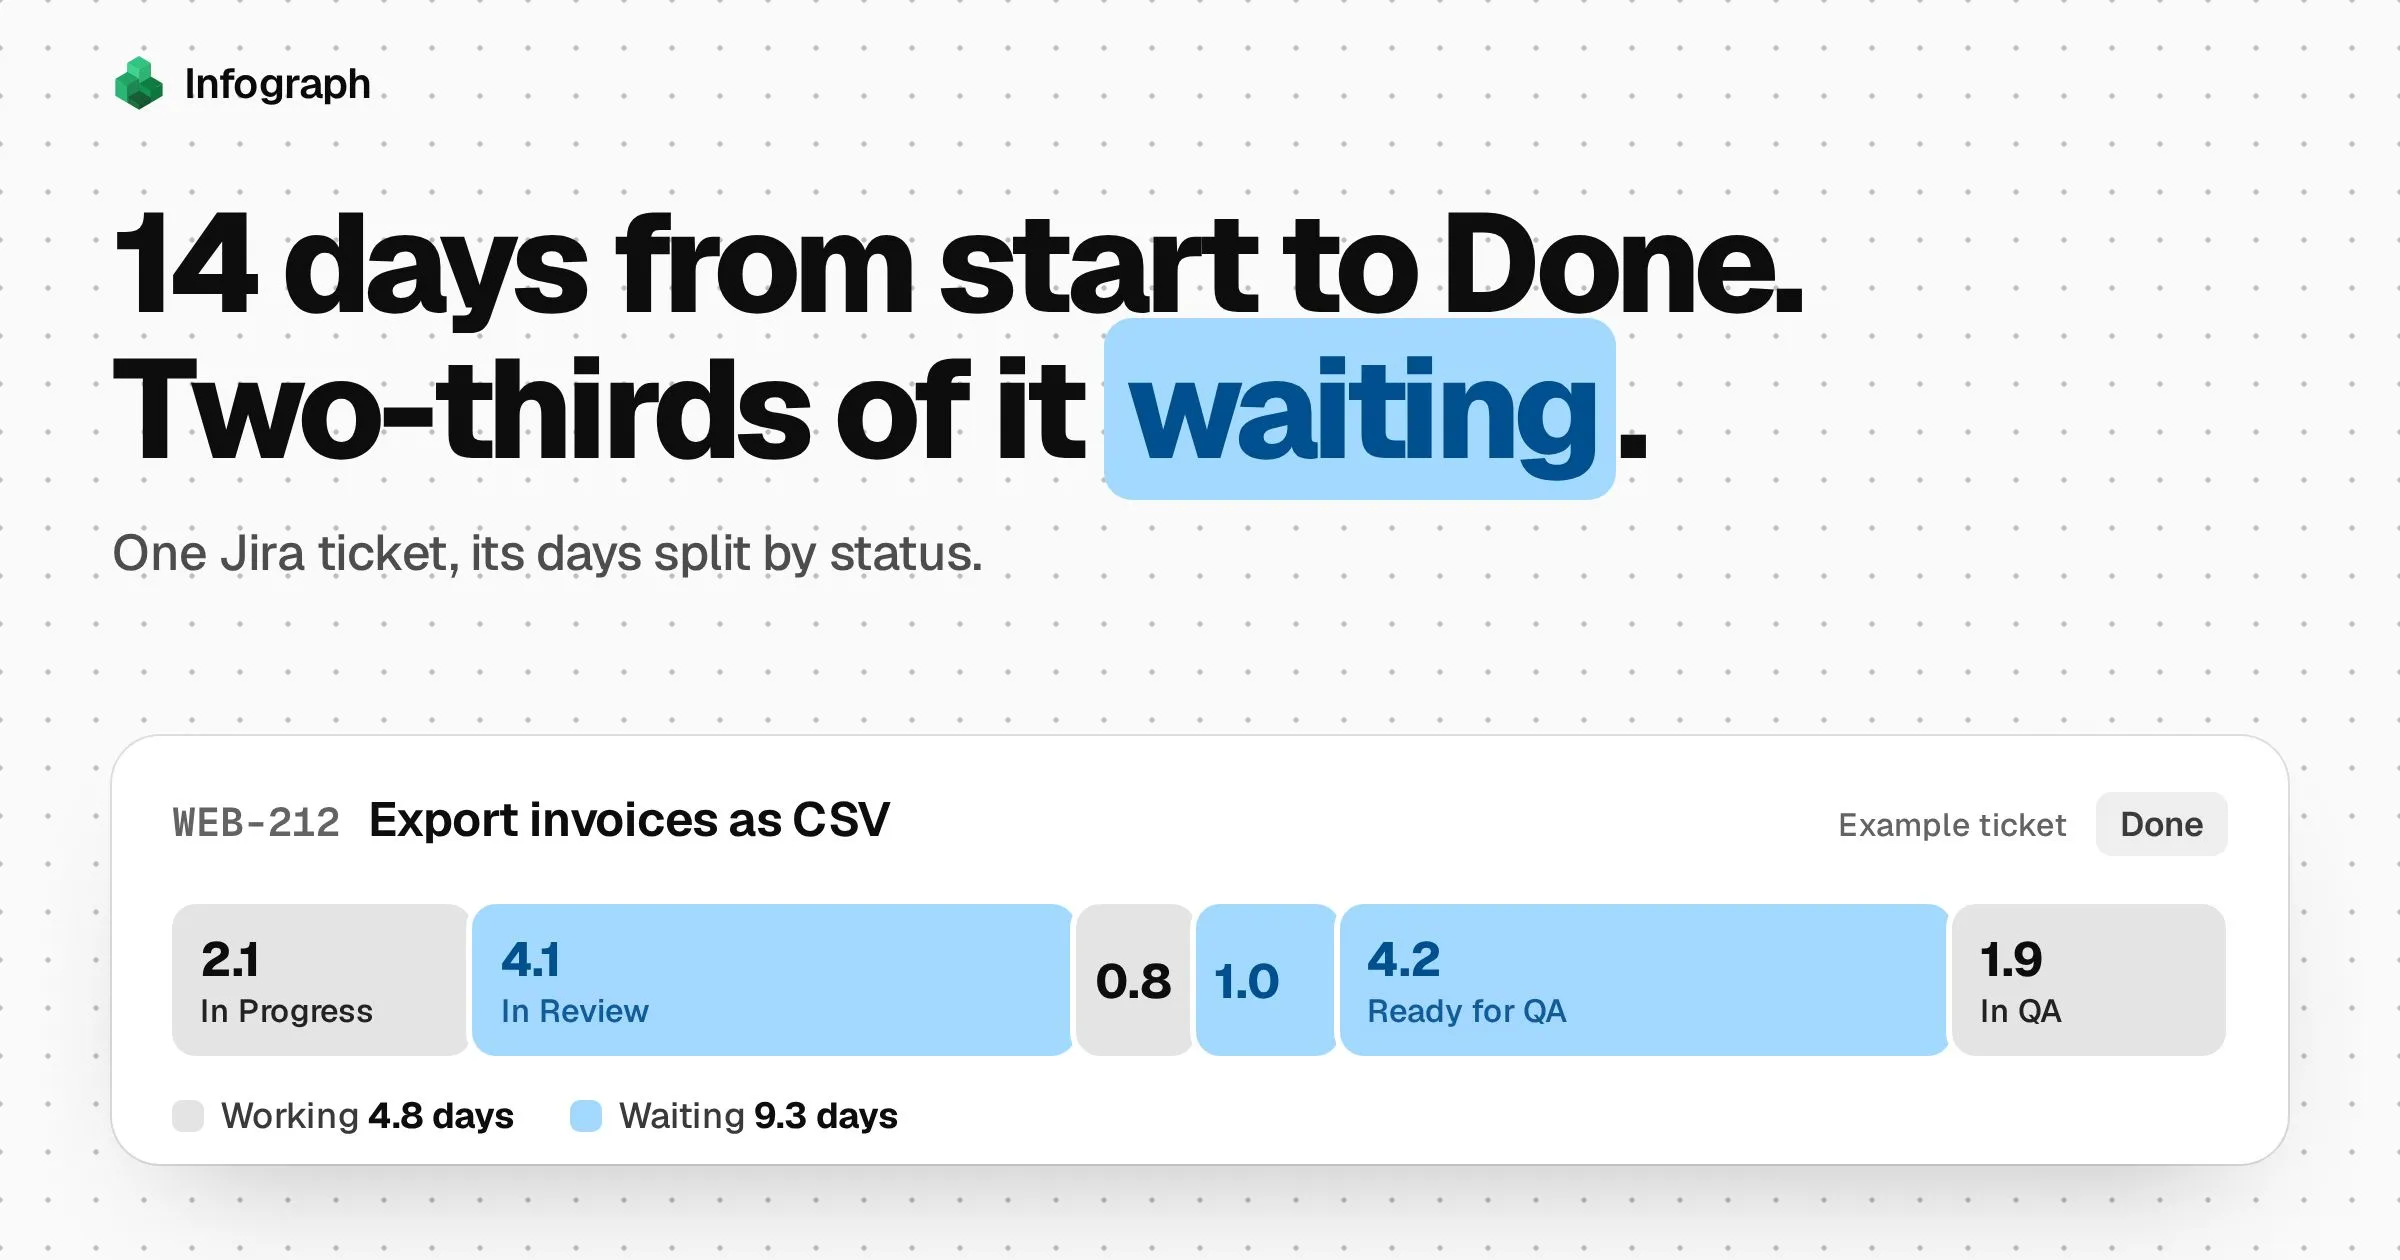
This is the time in status report. The bar at the top adds up every day that finished tickets spent between starting and finishing, and splits it by status. Below it, each status shows its median, with a dark mark for the previous period.
In Review takes the biggest share, 44% of all the time. Building the work, in In Progress, took 33%. A ticket’s median stay in review is 3.0 days, up from 2.1 in the 90 days before.
The days per status are medians, the middle value, so a few tickets that sat for weeks don’t drag them up. The shares in the bar add up every day, so slow tickets do count there.
Read cycle time ticket by ticket
If you’ve used Jira’s Control Chart, this will look familiar: one dot per finished ticket, placed by the day it finished and how long it took, under the same two lines as the board. Dotted lines mark releases.
In this sample, 43 tickets took longer than 16 days. Hover over a dot above the red line to see whether that ticket was slow to build or sat in a queue.
Watch what more work in progress does
The weekly chart sets three things side by side over the last 52 weeks: how many tickets were in progress on Monday morning, how many finished that week, and their median days from start to Done.
In the last 13 weeks, 33 tickets were in progress at the start of a typical week, against 22 in the same weeks a year earlier. The team finished about the same number each week, 21 then and 22 now.
Tickets took longer too. In a typical week, half the tickets finished took more than 8.0 days, against 6.3 a year earlier. That’s a typical week’s median, so it differs a little from the 8.1 days on the tiles, which counts all 90 days together.
If a team finishes the same number of tickets each week but has more on the go, the average ticket must take longer: it’s a longer queue moving at the same speed. That much is certain. What the chart can’t tell you is which came first. Did starting more work slow things down, or did slow reviews leave more work open?
To test it on your team, agree a limit on tickets in progress, such as the number you had in a quieter month. Start nothing new while you’re at the limit, keep it up for four weeks, and watch the median line.
The shaded weeks are quiet ones, when few tickets finished, like the Christmas break. Tickets that finished just after them had waited through the break, which is why the median line jumps in early January.
Check whether points predict days
Each row is one story point value, from 1 point at the top to 13 at the bottom. The box holds the middle half of the stories with that estimate. The blue mark is the median. The thin lines reach out to all but the fastest and slowest tenth. If points predicted days, the boxes would move steadily to the right as you go down the rows.
They don’t. Medians run from 7.9 days for 1-point stories to 12.7 for 5-point ones, and 8-point stories took 8.2 days, the same as 2- and 3-point stories. In this sample, knowing a story’s points tells you almost nothing about how long it took.
Points can still help a team judge how much fits in a sprint. But when someone asks when a ticket will be done, the 85th percentile is a safer answer: 85% of recent tickets finished within it.
Count the bugs that come back
The last panel follows bugs that went from Done back into work within 14 days.
Over the last 90 days, 11 of 81 bugs came back, 14%. From first start to final Done they took a median of 19.2 days, against 7.2 for bugs that stayed done: 2.7 times as long. Part of the extra time is a second trip through the same review and QA queues.
Should you use Jira’s own reports instead?
Sometimes. Each of these does part of the job well:
- Jira’s Control Chart is free and already there in company-managed projects (Jira’s classic project type). It’s good for a quick look at one board, and you choose which columns count.
- Insights, Atlassian’s analytics app on Enterprise plans (it used to be called Analytics), has a ready-made time in current status dashboard for open tickets.
- Marketplace apps such as Timepiece add time in status, cycle time and lead time reports inside Jira, with gadgets and exports. If you want the numbers inside Jira itself, an app is the way to go.
This dashboard puts the aging board, the time spent waiting, work in progress, story points and bugs that came back on one page, with nothing to install in Jira. Our time in status guide compares every way to get these numbers in detail.
Build a Jira dashboard from your own site
Connect Jira
Sign in with your Atlassian account, choose your Jira Cloud site, and accept the access request. Jira Data Center and Server aren’t supported. Infograph reads the projects and issues your account can browse, and can’t change anything in Jira. If your site blocks apps that users install, ask a site admin to allow Infograph first. You can also connect with an API token instead. The connection guide covers both.
Choose Issues and Statuses
When you connect, Infograph asks which parts of Jira to sync. Issues brings every ticket with its change history. Statuses tells Infograph how Jira groups your statuses into To Do, In Progress and Done. Add Projects and Versions to name your teams and releases. The first sync brings every issue updated in the last two years, and a big site loads in stages.
Ask Infograph for the dashboard
Tell Infograph what you want to know, in plain words, something like the request below. Include which of your statuses mean waiting. Jira puts In Review in its In Progress group, so only you can say it’s really a queue.
Every Monday I need to know where our work is waiting. Using my Jira issues and their status history, show which tickets in progress are older than the time 85% of our finished tickets took, and which column they are stuck in. In Review and Ready for QA mean waiting. Show our cycle time from first moving into progress to Done, how much of it is spent waiting, and the median days tickets spend in each status, for the last 30, 90 or 180 days. Leave out epics and tickets closed as Won’t Do, Duplicate or Cannot Reproduce.
One Jira connection works on the Free plan, where you press Sync to refresh. Plus syncs every day and Pro every 30 minutes (see the plans). GitHub is a second connection, so that option needs Plus.
One more way in
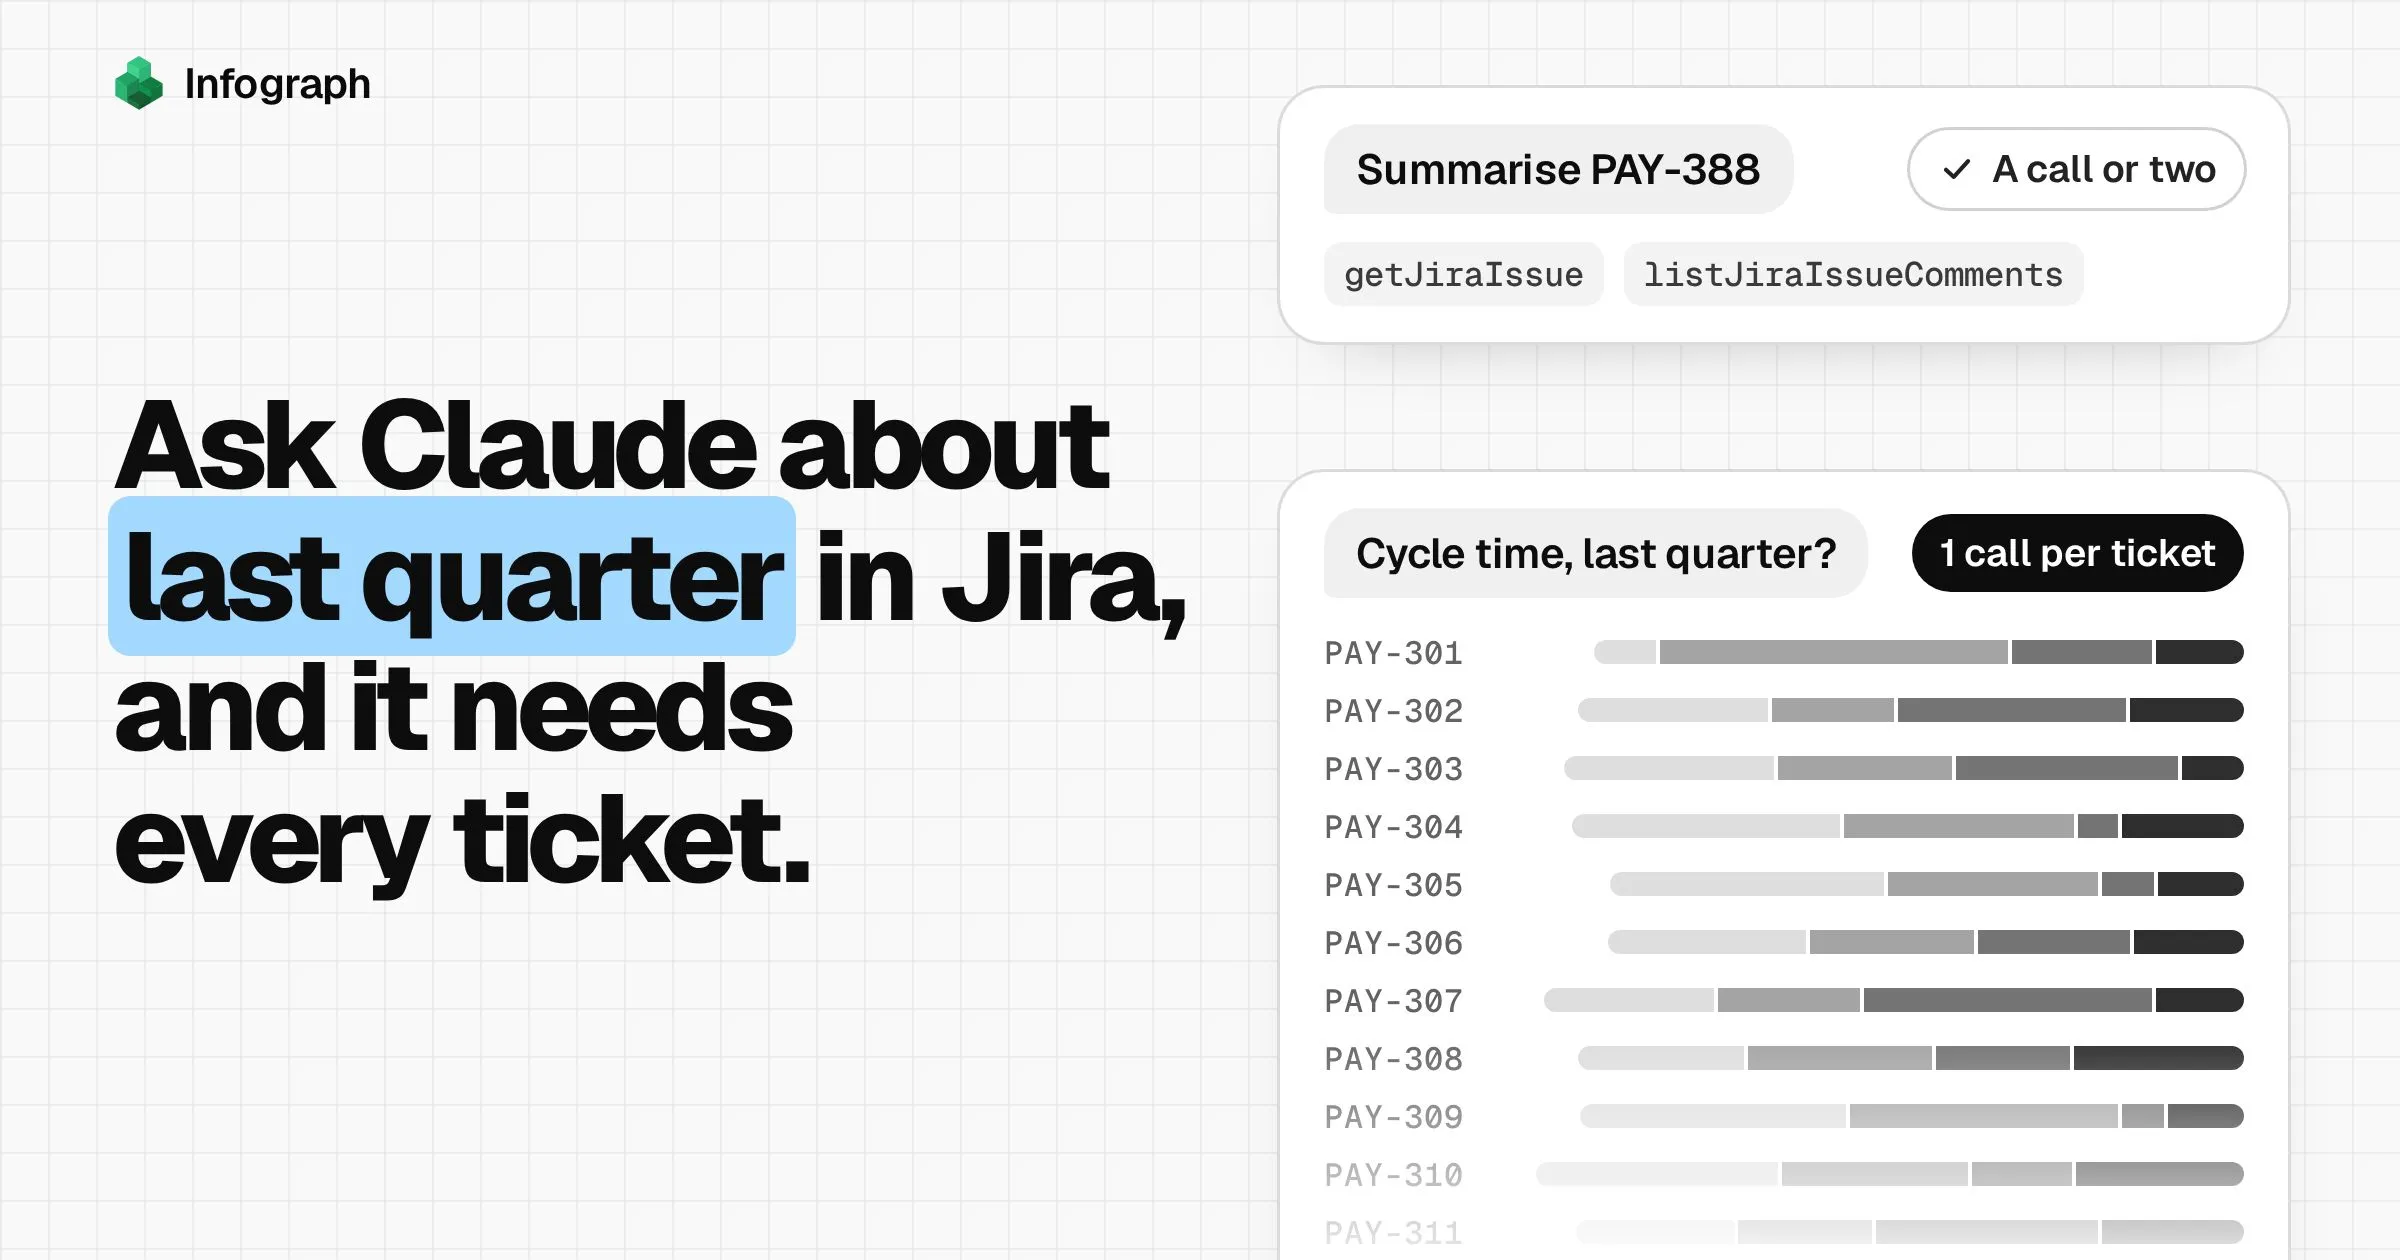
Ask Claude about the same history
MCP is the standard way AI assistants such as Claude plug into other apps. Add Infograph to Claude through it, and you can ask Claude about your synced Jira history, such as which tickets have waited longest in review this month. Infograph works the numbers out over all your tickets and gives Claude just the result. Atlassian’s own Jira connector for Claude is built for single tickets: its tool for reading history reads one ticket at a time. Claude and Jira shows how to set up both.
Jira dashboard questions
What is time in status in Jira?
How long a ticket spends in each status of your workflow, such as In Progress or In Review, worked out from the status changes Jira records on every ticket. Jira keeps the history but has no full report of it. This dashboard reads that history and shows the median days per status, and each open ticket's own timeline.
What's the difference between cycle time and lead time?
Cycle time runs from when work on a ticket starts to when it's done. Lead time runs from when the ticket was created, so it includes the time it sat in the backlog. This dashboard reports cycle time. Each ticket's timeline also shows its lead time.
Why do I have to say which statuses mean waiting?
Jira groups every status into To Do, In Progress or Done, and puts In Review in the In Progress group. Only you know which of your statuses are queues. This sample counts In Review and Ready for QA as waiting.
How does it handle renamed or skipped statuses?
Jira's history keeps the name a status had when the change happened. In this sample, In Review used to be called Code Review, and older changes under that name count as In Review. A ticket's clock starts the first time it moves into any status Jira counts as in progress, such as In Progress or In Review. So a ticket that skipped In Progress still counts from the day it entered review.
Does it count weekends?
It counts calendar days, because that's how long the person who asked for the work waits. Add the working days option to the prompt to leave out Saturdays and Sundays.
How much history will I see?
The first sync brings every issue updated in the last two years, each with its full change history. A ticket nobody has touched in two years is left out. Later syncs add new changes as they happen.
Which plan do I need?
One Jira connection fits the Free plan, where you press Sync before you look. Plus syncs every day, and Pro and Teams every 30 minutes. Adding GitHub makes two connections, which needs Plus. See the plans at infograph.ai/#pricing.
Can Infograph change anything in Jira?
No. It reads the projects and issues your account can browse, and never creates, edits or moves a ticket.
Can I ask Claude about this data?
Yes. MCP is the standard way AI assistants plug into other apps, and with Infograph added to Claude through it, Claude can query the synced Jira history directly while Infograph sends back only the answer. Our post on Claude and Jira shows how to set it up.
Will the prompt build exactly this page?
No. It builds your own version from your site, and the layout may differ. This sample was built in Infograph with more care over the look than a first answer will have, and you can keep asking for changes until it suits your team.
I'm having trouble connecting Jira
The guide covers each step and the errors you might see, such as an API token made without the right permissions or a site that blocks user-installed apps:
Is Rotaloom a real company?
No. It is a made-up software company, with two years of Jira tickets generated in exactly the shape Infograph syncs from Jira, so every panel on this dashboard can be built from a real Jira site.