Article
Jira Time in Status: Four Ways to Get It, and What Each Misses
Time in status is how long a Jira ticket sits in each status. Jira has no proper report for it: four ways to get one, what each misses, how to work it out.
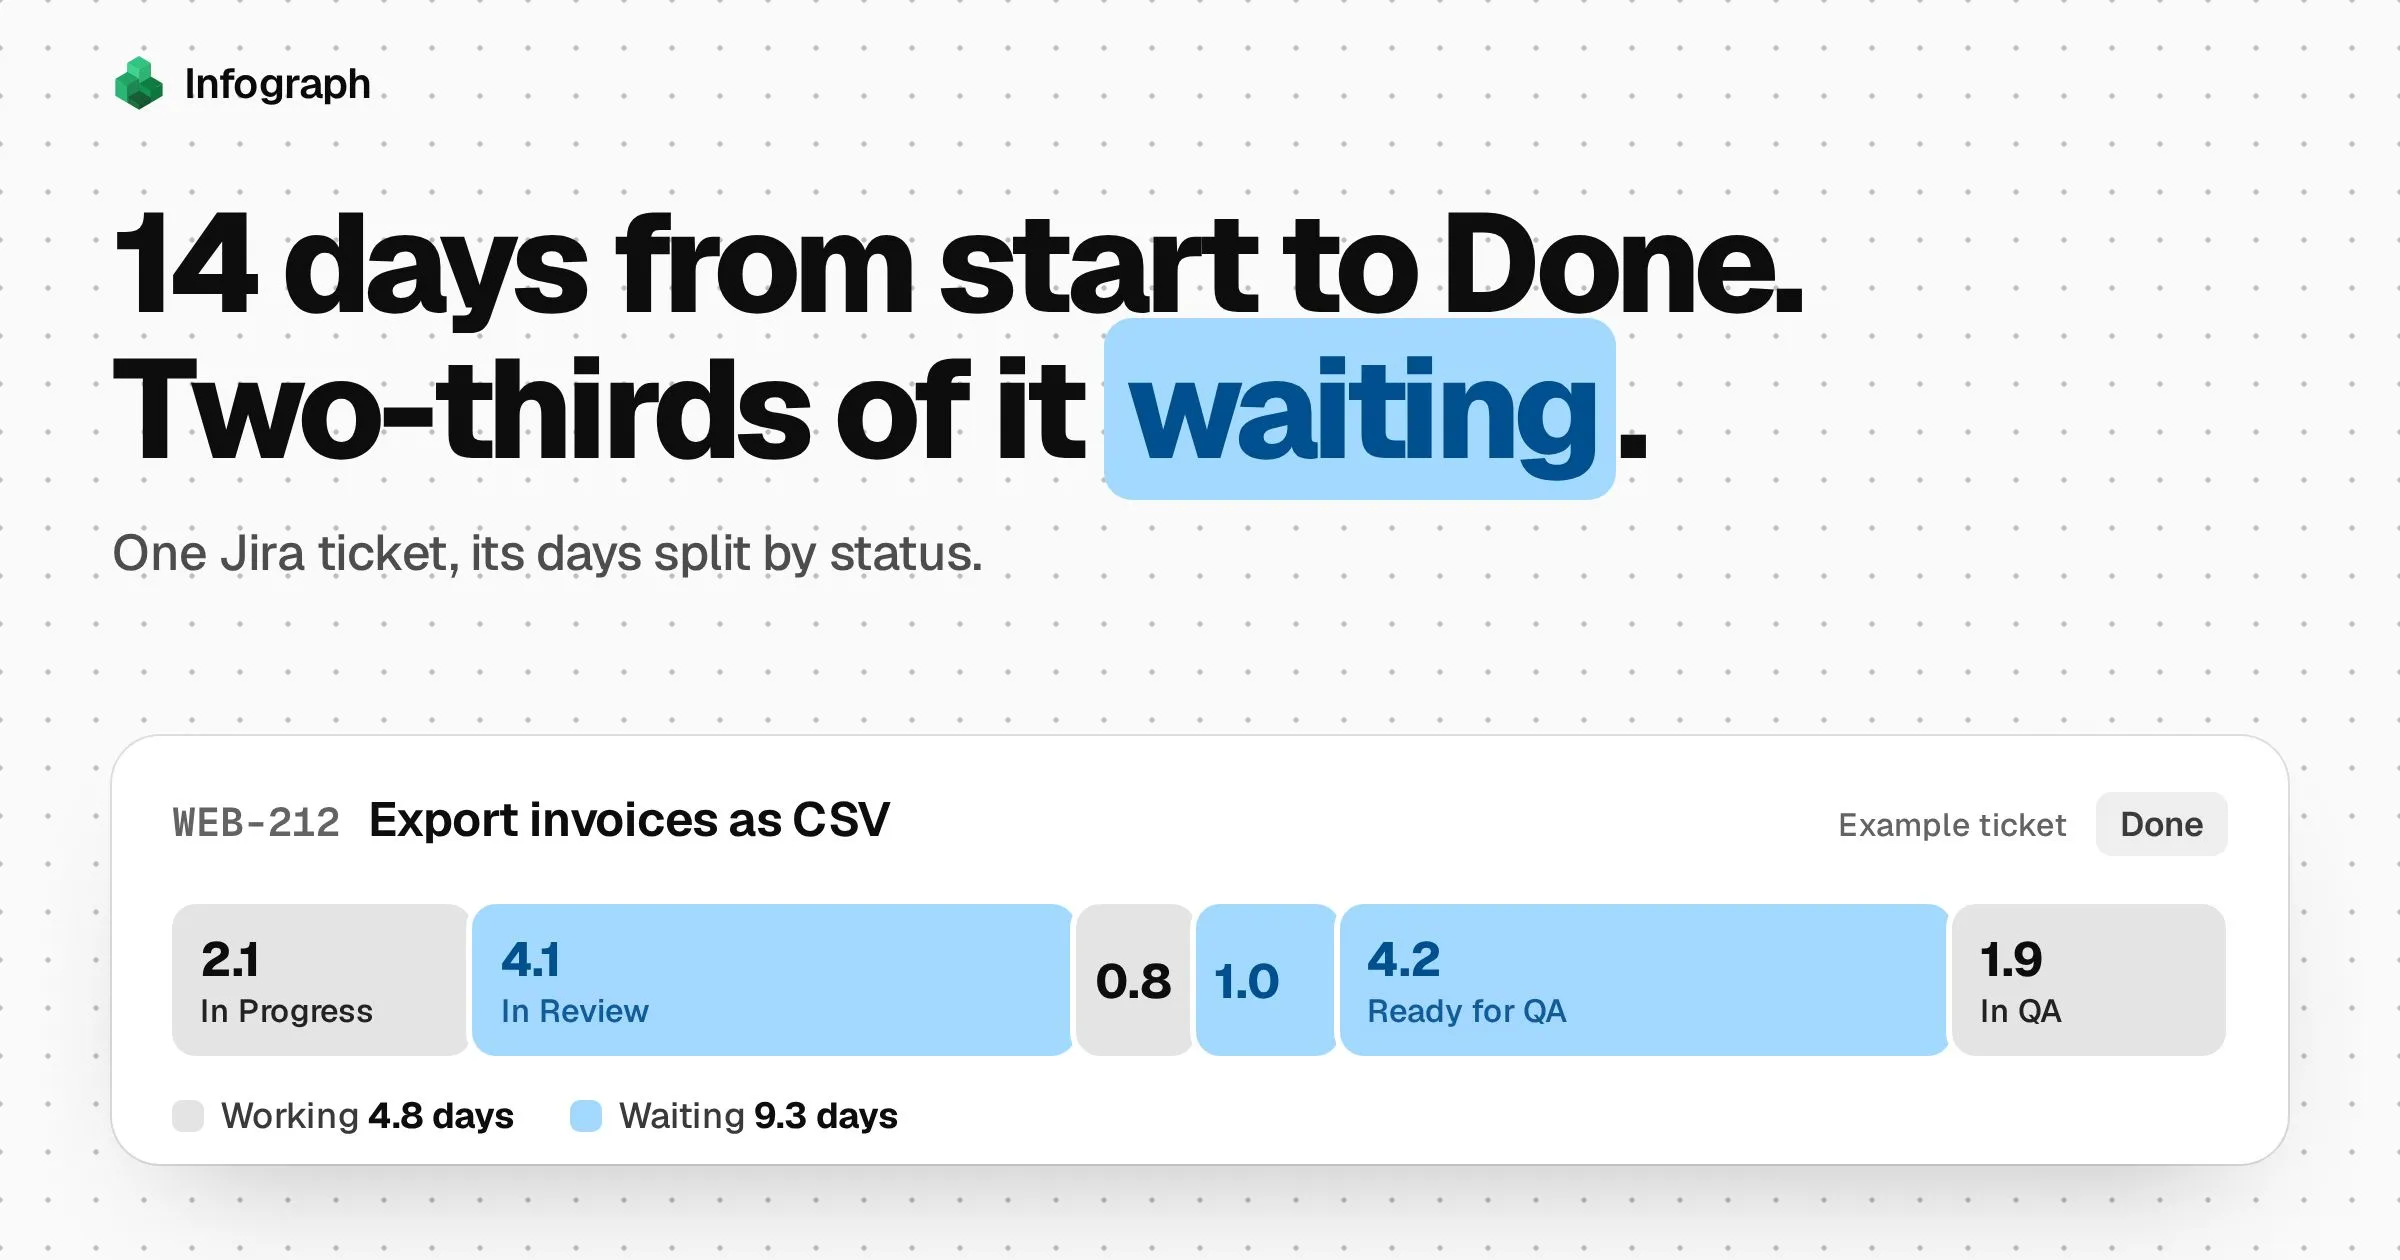
Time in status is how long a Jira ticket spends in each status, such as In Progress, In Review or Ready for QA, before it moves on. Add it up across your finished tickets and it shows where work gets stuck.
Jira Cloud doesn’t have a proper report for it. Its built-in charts show averages, or one status at a time, but never a ticket’s days split across all its statuses. A request to add one has been open on Atlassian’s own tracker since May 2016 (JRACLOUD-90221).
What Jira does keep is the raw material. Every ticket has a history, called the changelog, that records each status change and when it happened. There are four ways to turn that history into days per status, and each one misses something.
Which route fits you
- Jira’s own charts. Free and already there. But they show averages, or one status at a time.
- Automation rules. Free, and the number sits on each ticket. But they only count from the day you set them up.
- A Marketplace app. The number inside every ticket, for everyone. But it’s paid, and priced on every user of your Jira.
- The changelog itself, read through Jira’s API or copied out by a tool that connects to Jira. Your whole history, and any question you like. But you decide the counting rules, such as how to treat weekends and reopened tickets (covered below).
Short version: for a quick look this week, use Jira’s own charts. For the number on every ticket, old and new, an app is easiest. To see where months of your team’s time went, use the changelog.
This post is about Jira Cloud, the Jira you open at yourcompany.atlassian.net. Atlassian now calls issues “work items” and projects “spaces”, so your screens may say either. We’ll say ticket.
Four ways to get time in status in Jira
1. Jira’s own charts: free, but averages or one status at a time
The Average Time in Status gadget. A gadget is a chart you add to a Jira dashboard, and this one is built in. Point it at a project, pick a status and a period, and it charts the average days tickets spent there. It’s an average across tickets, not a breakdown of any one ticket. Watch out for two things, both from bug reports on Atlassian’s tracker. It only counts tickets resolved (marked done) in that period (JRACLOUD-74324). And its numbers go wrong when different ticket types follow different steps (JRACLOUD-75778). Atlassian closed both reports without a fix. A second gadget, Average Number of Times in Status, counts how often tickets come back to a status, which is a free way to see rework.
The Control Chart. It’s under Reports. Pick the board columns that count as work, say In Progress through In QA. (A column can hold more than one status.) Each ticket becomes a dot showing how long it spent in those columns, and you can select a dot to see which ticket it is. Lines and a shaded band show the average and how much tickets vary. It can leave out weekends and holidays, using your board’s Working days setting. Pick a single column and each dot shows that ticket’s time in it, which is time in status when the column holds one status.
What the Control Chart misses:
- It gives one total per ticket, so you can’t see review and QA side by side.
- It only exists in company-managed projects, not team-managed ones (the simpler kind a team sets up for itself). To check which you have, select More actions (•••) next to the project name; the project’s details are at the bottom of that menu.
- By default it also counts tickets that haven’t reached Done yet. Atlassian suggests a quick filter to show finished work only.
- You can’t export the times. Atlassian’s page suggests printing it.
Days in column. On the board, this puts dots on each card to show how long it has sat in its column. It’s on by default for kanban boards and off for scrum boards (Customize cards). It’s handy for spotting a stuck ticket at standup. It isn’t a report, though: it only covers the column each card is in right now.
On the Enterprise plan, Atlassian’s Analytics app (now called Insights) adds two ready-made dashboards, Time-in-status history and Time in current status. Both look at open tickets only: how long they’ve sat in their current and earlier statuses. So they show what’s stuck now rather than where finished work spent its time.
2. Automation rules: free, from the day you start
Jira Automation is the built-in tool for rules like “when a ticket moves to In Review, do this”. Atlassian’s own recipe, Get the amount of time a Jira issue was in a status using automation, works like this for one status:
- Add a date-and-time field to your tickets, for example Entered Review.
- Rule one: when a ticket moves into In Review, set that field to the current time.
- Rule two: when the ticket leaves In Review, work out the gap and save it in a number field. Atlassian’s example uses a smart value (Automation’s formula language) like
{{Entered Review.diff(now).hours}}. UsebusinessDaysinstead ofhoursto skip weekends. - To cover tickets that come back to In Review, rule two also adds each gap to a running total in a second number field.
The result sits on the ticket, so you can search and filter by it. What it misses:
- It only counts from the day you switch it on. Every ticket finished before then has nothing.
- It’s two rules and two or three fields for every status you want to measure. Five statuses means ten rules to update whenever your statuses change.
- If a field isn’t added to the ticket’s layout (the list of fields the ticket shows), it stops updating without telling you, as Atlassian warns.
- Every run counts toward your plan’s monthly automation allowance (how Atlassian counts it).
- If a rule is paused or fails for an afternoon, the moves it missed are gone for good.
It suits one or two statuses you care about a lot, such as Waiting for customer.
3. A Marketplace app: inside every ticket, but paid
Marketplace apps are add-ons for Jira, what most people call plugins. Apps such as Timepiece by OBSS and SaaSJet’s Time in Status read the history Jira already keeps, so your older tickets are included from day one. They add dashboard charts, working calendars with holidays, and exports to Excel. Timepiece also puts a time in status tab inside each ticket.
If you want the number inside every ticket, for everyone on the team, pick an app.
What it costs you:
- Money. A cloud app is priced on every user of your Jira, “even if only a few people use the app”, as SaaSJet’s own pricing help puts it. Several makers, OBSS among them, say theirs is free if your Jira has up to 10 users (in this Community thread).
- A Jira admin has to install it and give it access to your Jira data.
- The numbers stay in Jira. To compare them with data from your other tools, you export them.
4. The changelog: your whole history, your rules
Every Jira ticket keeps a changelog: a list of every change made to it, with the time. Each status change is in there, for example “In Progress to In Review, Fri 6 Feb, 11:05”. To see one, open a ticket, go to Activity and choose History.
There are two ways to get the changelog out for all your tickets. The first is Jira’s API, the way programs read Jira’s data, which means someone writes a script. If that’s you, three things to know:
GET /rest/api/3/issue/{key}/changelogreturns one ticket’s whole history, oldest first.POST /rest/api/3/changelog/bulkfetchtakes up to 1,000 tickets at a time and can return status changes only.- The ticket search with
expand=changelogreturns only each ticket’s recent changes, newest first. A ticket with a long history comes back missing its early moves, so fetch its full changelog, and sort every ticket’s changes by time. - A ticket’s first status has no change entry, because creating a ticket isn’t a change. Start it at the ticket’s Created date.
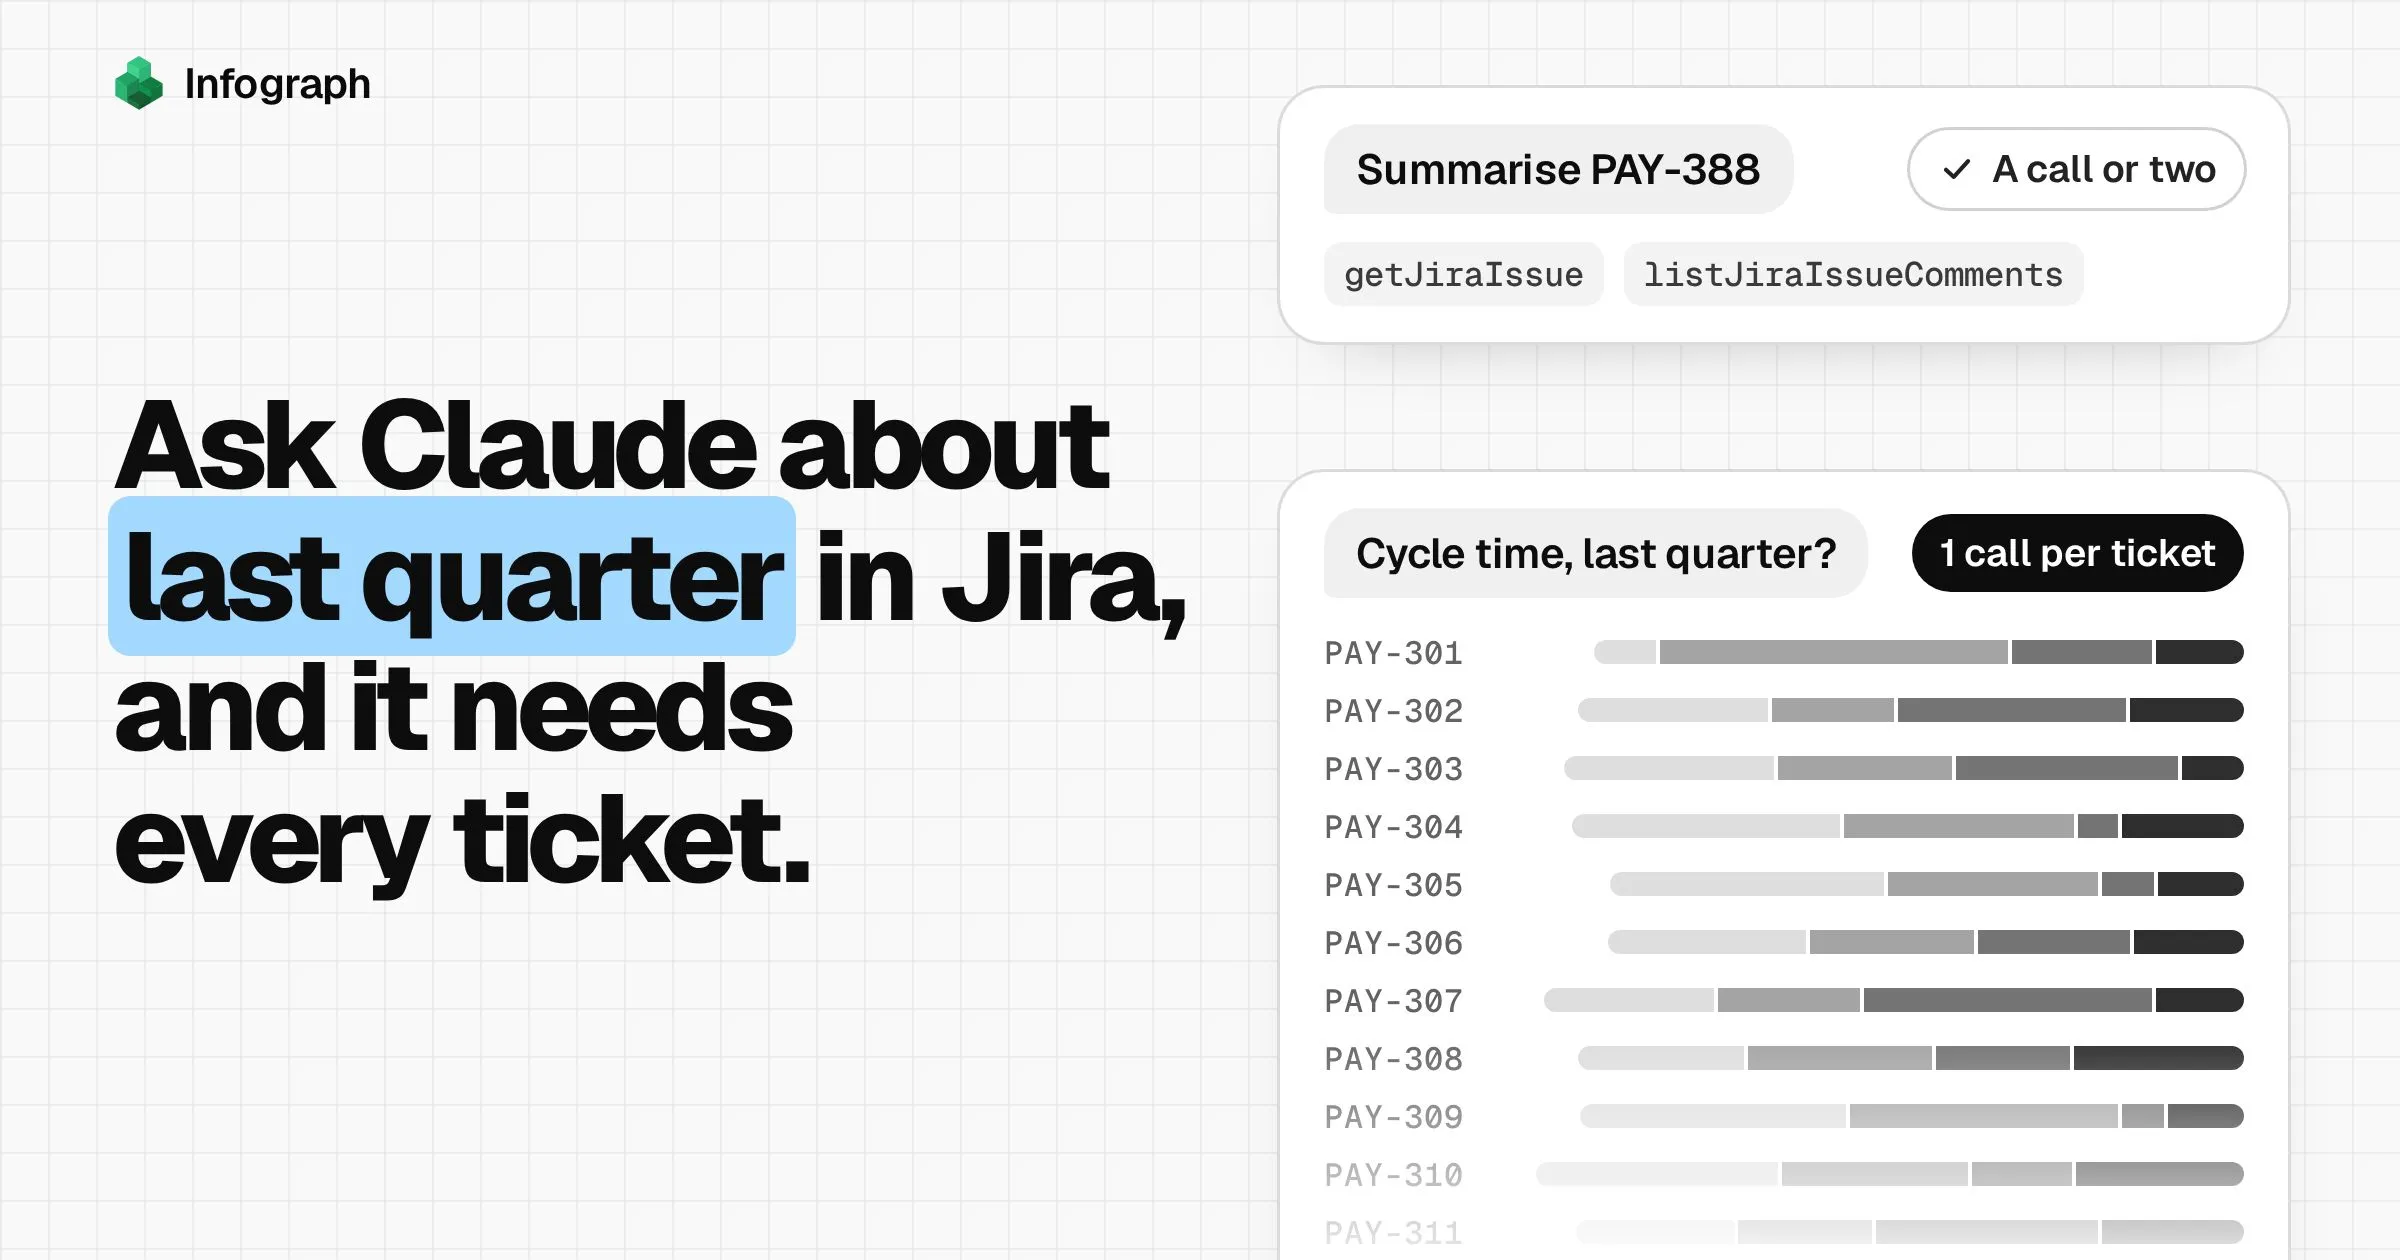
The second is a tool that copies it for you. When you connect Jira to Infograph (our tool for asking questions of your business data) and pick Issues, it copies every ticket updated in the last two years, each with its full history. Then you ask for what you want in plain words.
What it misses: the number doesn’t appear inside Jira, and it isn’t live. Depending on your plan it syncs every 30 minutes, daily, or when you press sync (plans). Tickets nobody has touched in two years aren’t copied. And you still choose the counting rules below; Infograph applies the ones you give it.
How to calculate time in status, one ticket by hand
Whichever route you pick, work out one ticket by hand once. Then you can check any tool’s number against it.
Here’s a made-up ticket, WEB-212, “Export invoices as CSV”. It was created on a Monday, sent back from review once, and finished a little over two weeks later. Here are its status changes, starting with its creation:
| When | From | To |
|---|---|---|
| Mon 2 Feb, 10:12 | (created) | To Do |
| Wed 4 Feb, 09:40 | To Do | In Progress |
| Fri 6 Feb, 11:05 | In Progress | In Review |
| Tue 10 Feb, 14:30 | In Review | In Progress |
| Wed 11 Feb, 10:15 | In Progress | In Review |
| Thu 12 Feb, 09:50 | In Review | Ready for QA |
| Mon 16 Feb, 14:40 | Ready for QA | In QA |
| Wed 18 Feb, 11:45 | In QA | Done |
Time in a status is the gap between entering it and leaving it. If the ticket visits a status twice, add both visits together. Cycle time is the time from starting work to Done, so it leaves out the days in To Do:
| Status | Visits | Calendar days | Working days |
|---|---|---|---|
| In Progress | 2 | 2.9 | 2.9 |
| In Review | 2 | 5.1 | 3.1 |
| Ready for QA | 1 | 4.2 | 2.2 |
| In QA | 1 | 1.9 | 1.9 |
| Cycle time (In Progress to Done) | 14.1 | 10.1 | |
| To Do, before work started (not in cycle time) | 1 | 2.0 | 2.0 |
For WEB-212, cycle time is 14.1 days.
We’ll count two of those statuses as waiting. In Review is the queue for a reviewer, and Ready for QA (quality assurance) is the queue for a tester. Together they hold 9.3 of the 14.1 days, about two-thirds.
The Control Chart would show this ticket as a single dot at 14.1 days, or 10.1 if your board’s Working days setting leaves out weekends. The split by status is the part it can’t show.
The rules that decide the number
Every tool makes these choices, often without telling you. Make them yourself, and write them down.
Start at the first In Progress, stop at the last Done
Start cycle time the first time a ticket enters a working status, such as In Progress. Stop it the last time it reaches Done. That’s the rule Atlassian’s own flow metrics dashboard, part of its Analytics app, uses. If a ticket is reopened and finished again, the clock runs until that last Done. So the extra work counts, and so do the days it sat in Done before someone reopened it, because it wasn’t really finished. Keep a separate count of reopened tickets too, since a lot of reopens is a problem of its own.
Name your waiting statuses yourself
Behind the scenes, Jira puts every status into one of three categories: to do, in progress or done. In Review and Ready for QA are in the in-progress category, alongside the real work, so Jira itself can’t tell waiting from working. You have to say which statuses are waiting. Often that’s In Review, Ready for QA, Blocked and anything starting with “Waiting”.
In Review is the hard one. Part of it is someone reviewing, and part is waiting for them, and the changelog can’t split the two. Decide whether it counts as waiting or working, and say which. In WEB-212 we counted it as waiting.
A flag isn’t a status. A ticket flagged as blocked keeps its status, so time in status won’t see the flag. Flag changes are in the changelog too, if you want to count them.
Calendar days or working days
WEB-212 took 14.1 calendar days, or 10.1 working days. The gap is the two weekends it spent in a queue. Calendar days count weekends, because whoever asked for the work is still waiting on a Sunday. Working days are fairer when you compare a fortnight with a public holiday in it to one without. We’d use calendar days for your regular numbers, and working days only when comparing two periods.
Either way, use one time zone for everyone, so the weekend starts at the same moment for the whole team.
Use medians and the 85th percentile
One ticket parked for three months drags an average a long way. The median is the middle ticket: half took longer, half took less. The 85th percentile is the time that 85 out of 100 tickets finish within, so it’s the number to give when someone asks when theirs will be done.
Decide what skipped statuses mean
Some tickets skip a status, for example going straight from In Progress to Done with no review. You can count that as zero days in review, which pulls the median down. Or you can leave those tickets out, so the median describes only reviewed tickets. Both are fine. Say which you did, and how many tickets skipped it.
Count finished work, like with like
Leave out tickets closed without the work being done, such as Duplicate or Won’t Do. Atlassian’s Control Chart page warns that they “can skew the data, bringing the average cycle time down considerably”.
Compare one ticket type at a time, because a bug and a story often go through different statuses. Leave out epics, which are containers for other tickets, and sub-tasks, whose time is already part of their parent.
Keep open tickets separate
A ticket still in Ready for QA has a clock that hasn’t stopped. Keep it out of the numbers for finished work. List open tickets on their own, by how long they’ve sat where they are now. That’s the list you’ll act on this week.
Map renamed statuses
The changelog keeps a status’s name as it was on the day of the change. If you renamed Code Review to In Review in June, older changes still say Code Review. Jira’s search docs (JQL) say the same. Keep a short list of old names and their new ones, and apply it before you add anything up. A script that reads each status’s ID number instead of its name doesn’t need this. In Infograph, tell it which old name is which new one.
Cycle time vs lead time in Jira
Lead time runs from the moment a ticket is created to Done. It’s the whole wait, as the person who asked for the work sees it. Cycle time runs from when work starts to Done. It’s the part the team controls.
For WEB-212, lead time is 16.1 days and cycle time is 14.1. The two days between them are the ticket sitting in To Do.
A big gap between the two means tickets wait a long time before anyone starts them. Two similar numbers mean the delay is inside your workflow, and that’s where time in status helps.
Atlassian’s Control Chart page uses the same definitions. Not everyone counts review in cycle time, though. Tempo, which makes Jira apps, leaves time spent waiting in review out of cycle time in its lead time vs cycle time article. Atlassian keeps it in, and so do we, because a ticket waiting for review hasn’t shipped.
One more name to watch: Jira also has a Cycle time report, under Reports, then DevOps. It measures something narrower: the time from a developer’s first code change to its release, and only if your code tools are connected to Jira.
What to do with the numbers
- Work out the waiting share: all the days finished tickets spent in waiting statuses, divided by all their days of cycle time.
- If most of the time is waiting, a shorter queue will speed up delivery more than faster work will.
- Find the waiting status that holds the most days, and the open tickets that have sat in it longest.
- Try one change for four weeks, such as a limit on tickets in review or a fixed review slot each day. Then see whether that status’s median goes down.
Leave people out of it. Time in status by person turns into a leaderboard, and a leaderboard teaches people to move tickets along rather than finish them.
Time in status from your Jira, in Infograph
Here’s route four, with nothing to write yourself.
Connect Jira
Sign in with your Atlassian account and choose your site. Pick Issues and Statuses. Issues brings each ticket’s change history, and Statuses lists your statuses and their categories. Infograph only reads; it never changes anything in Jira.
Ask for time in status
Using my Jira issues and their status history, show the median days finished tickets spent in each status over the last 90 days. Count calendar days, add up repeat visits to a status, and treat In Review and Ready for QA as waiting. Show what share of cycle time was waiting, and list the open tickets that have sat longest in their current status.
Check one ticket by hand
Pick a ticket you remember well and ask for its status history, laid out like WEB-212’s above. If the days match what you worked out, the rules are doing what you meant.
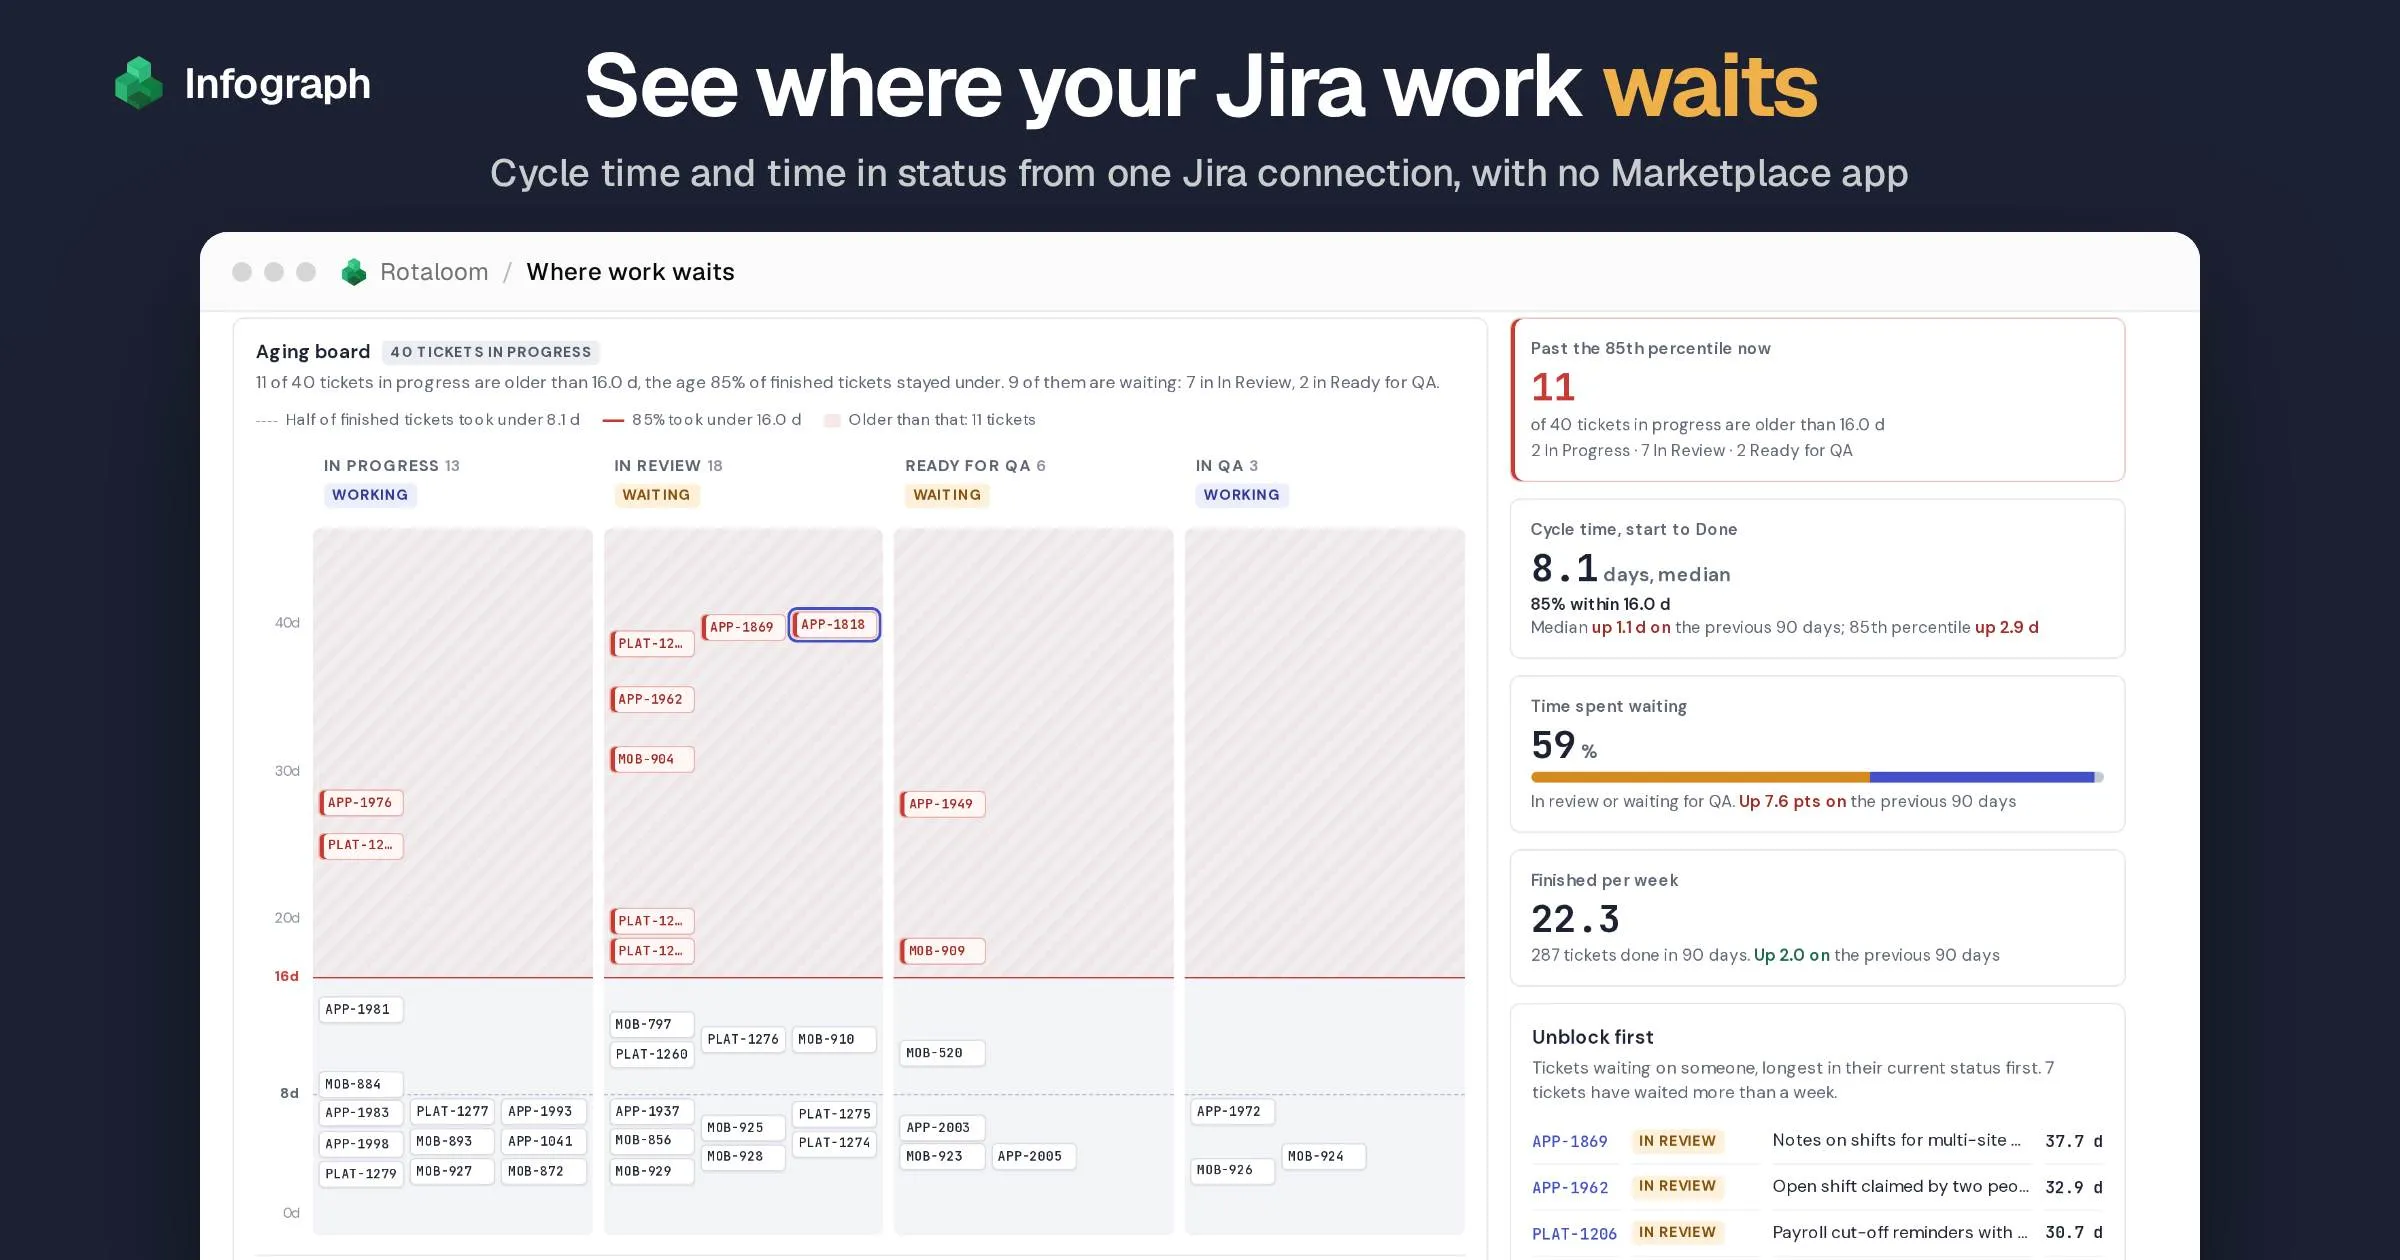
Here’s the same calculation across a whole team. We built a Jira dashboard for Rotaloom, a made-up software company, on sample tickets in the same shape a real Jira connection brings in. Its “Where the days go” panel adds up the days 287 finished tickets spent between starting and finishing over the last 90 days, and splits them by status. Waiting statuses took 59% of that time, and In Review held the most, 44%.
The panel follows two of the rules above. Each median counts only the tickets that passed through that status, and changes made while In Review was still called Code Review count as In Review. You can open the dashboard, switch to 30 or 180 days, or pick one project.
Your own version needs one Jira connection, and the Free plan includes one (plans). The number won’t appear inside Jira’s ticket view, though. If that’s what your team needs, a Marketplace app is the better choice.
Does Jira have a time in status report?
Not a real one. Time in status is how long a ticket spends in each status. Jira Cloud has an Average Time in Status dashboard gadget, which charts averages for resolved tickets, and the Control Chart, which adds up the time in the board columns you choose. Neither shows one ticket's days split by status. On the Enterprise plan, Atlassian's Analytics app, now called Insights, has time in status dashboards for open tickets.
How do I get time in status in Jira without a plugin?
Use the Average Time in Status gadget or the Control Chart, one column at a time, for averages. Use Automation rules that record when a ticket enters and leaves a status, from the day you set them up. Or read each ticket's changelog through Jira's API, or copy it out with a tool such as Infograph.
Where can I see one ticket's status history in Jira?
Open the ticket, go to the Activity section and choose History. It lists every change, including each status change and when it happened.
Can JQL show time in status?
No. JQL, Jira's search language, finds tickets, but it can't measure how long they sat anywhere. It can still list stuck ones: status = "In Review" AND NOT status CHANGED AFTER -5d finds tickets that have been in In Review for at least five days.
How is cycle time calculated in Jira?
The Control Chart adds up the time each ticket spent in the columns you select, including work after a reopen. Atlassian's flow metrics dashboard measures from the first move into a working status to the last move into Done. Pick one rule and use it every time.
What is the difference between cycle time and lead time in Jira?
Lead time starts when the ticket is created. Cycle time starts when work begins. Both end at Done, and the gap between them is the time the ticket waited before anyone started it.
Is the Control Chart available in team-managed projects?
No. Atlassian documents the Control Chart for company-managed projects only. To check which kind you have, select More actions (•••) next to the project name. The other routes in this post still work in team-managed projects.
Why doesn't an app's time in status match the Control Chart?
Check which columns or statuses each one includes, whether it counts calendar or working days, and whether repeat visits and reopened tickets are added up. Working out one ticket by hand shows which setting differs.
Does Infograph change anything in Jira?
No. It reads the projects and issues your Atlassian account can browse and never writes to Jira.
Get answers from all of your data
Infograph reads everything you connect and turns a question in plain words into an answer, a data report or a live dashboard.
Answers, reports and dashboards
Ask a question and get back what it needs: a straight answer, a written report or a dashboard that stays live.
Frontier intelligence
The latest models from the leading labs, chosen for speed, intelligence, price or open source.
Every app and kind of data
Upload files or connect your apps and databases. Infosync keeps them fresh, with nothing to schedule.
 Built with Infograph