Guide
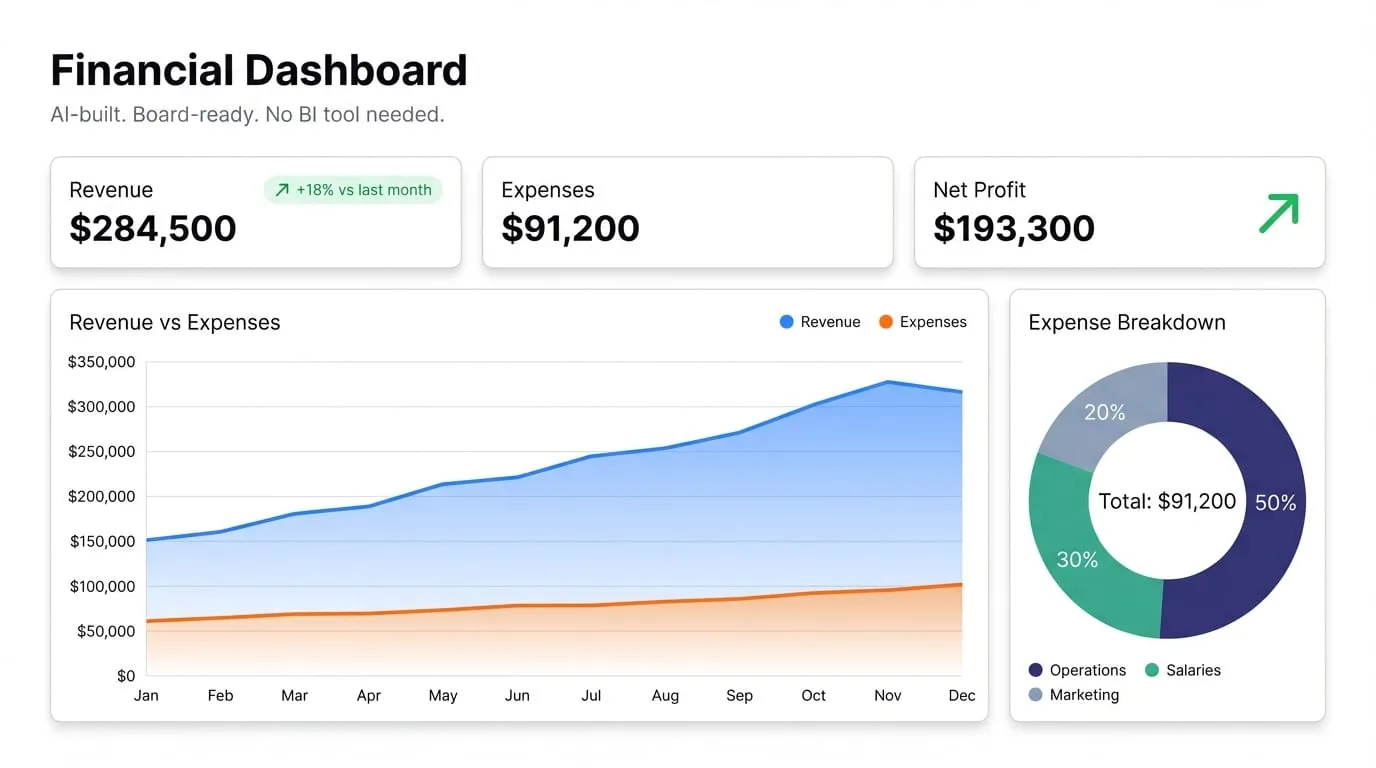
Build a Financial Dashboard with AI — No BI Tool Required
Finance teams spend hours in spreadsheets building reports that could take seconds. Here's how to build a financial dashboard with AI — no data team, no BI tool needed.
Finance teams spend hours in spreadsheets building reports that could take seconds. Here's how to build a financial dashboard with AI — no data team, no BI tool needed.
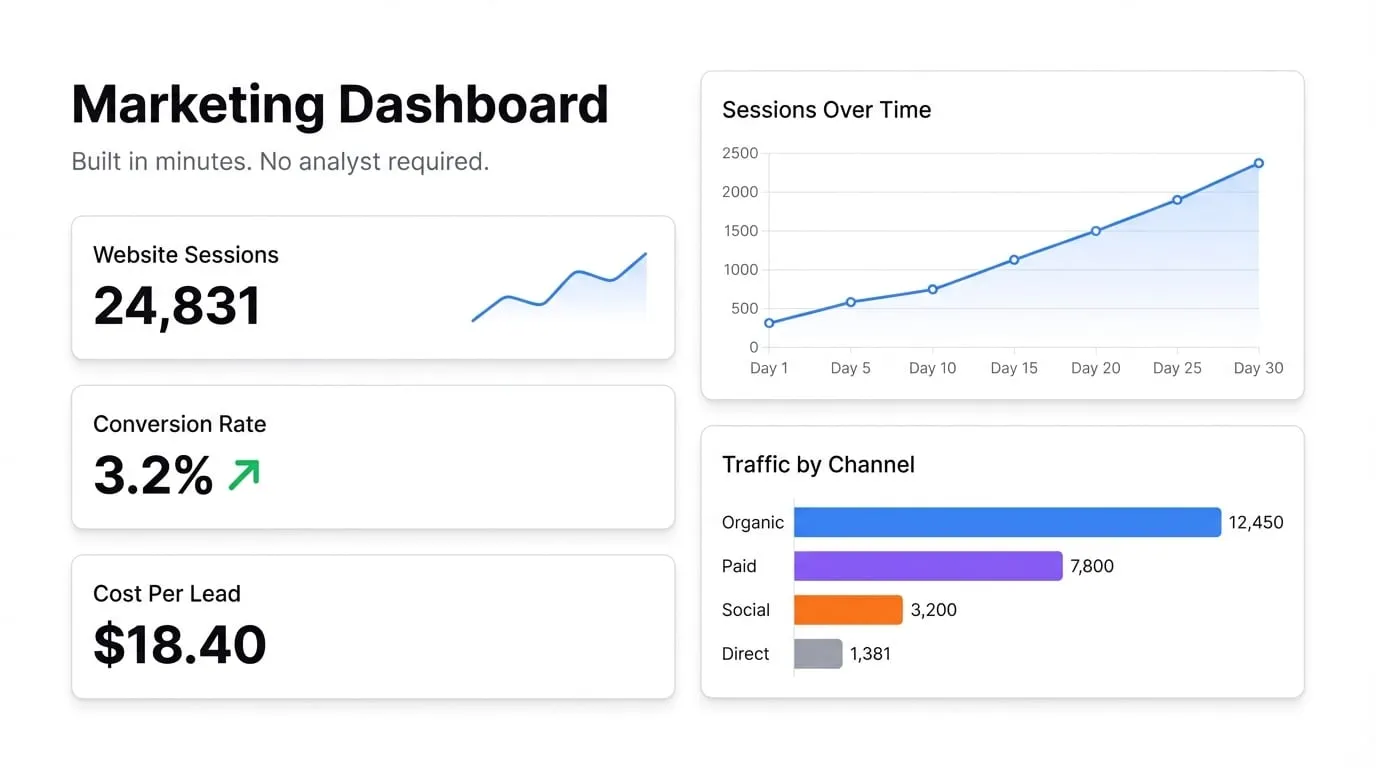
Most marketing dashboards show everything and tell you nothing. Here's how to build one that cuts through the noise and shows the metrics that actually drive decisions.
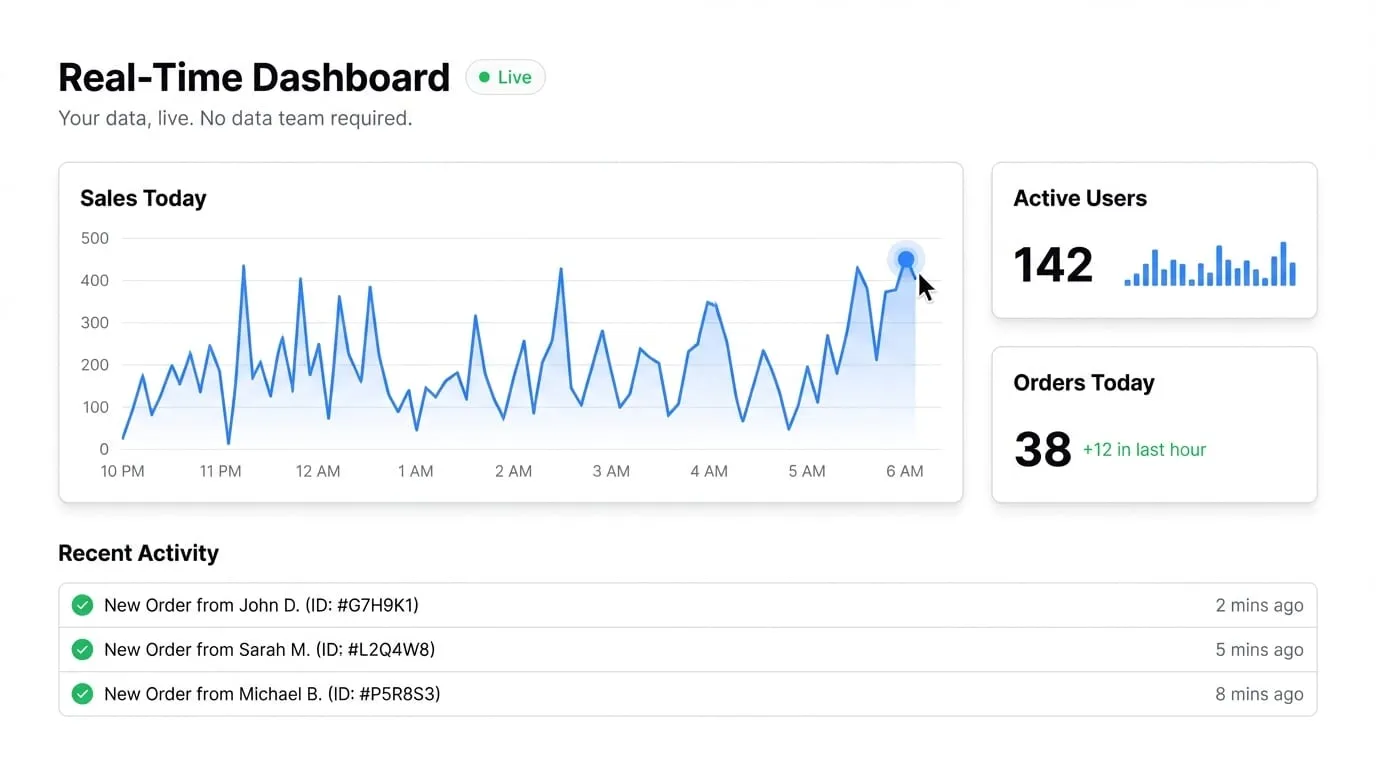
Real-time dashboards used to require a data engineer and a BI tool. Now they don't. Here's how teams without technical resources can build live dashboards that actually stay current.

Static reports require effort to interpret, go stale the moment you send them, and get buried in inboxes. Here's what actually drives action instead.
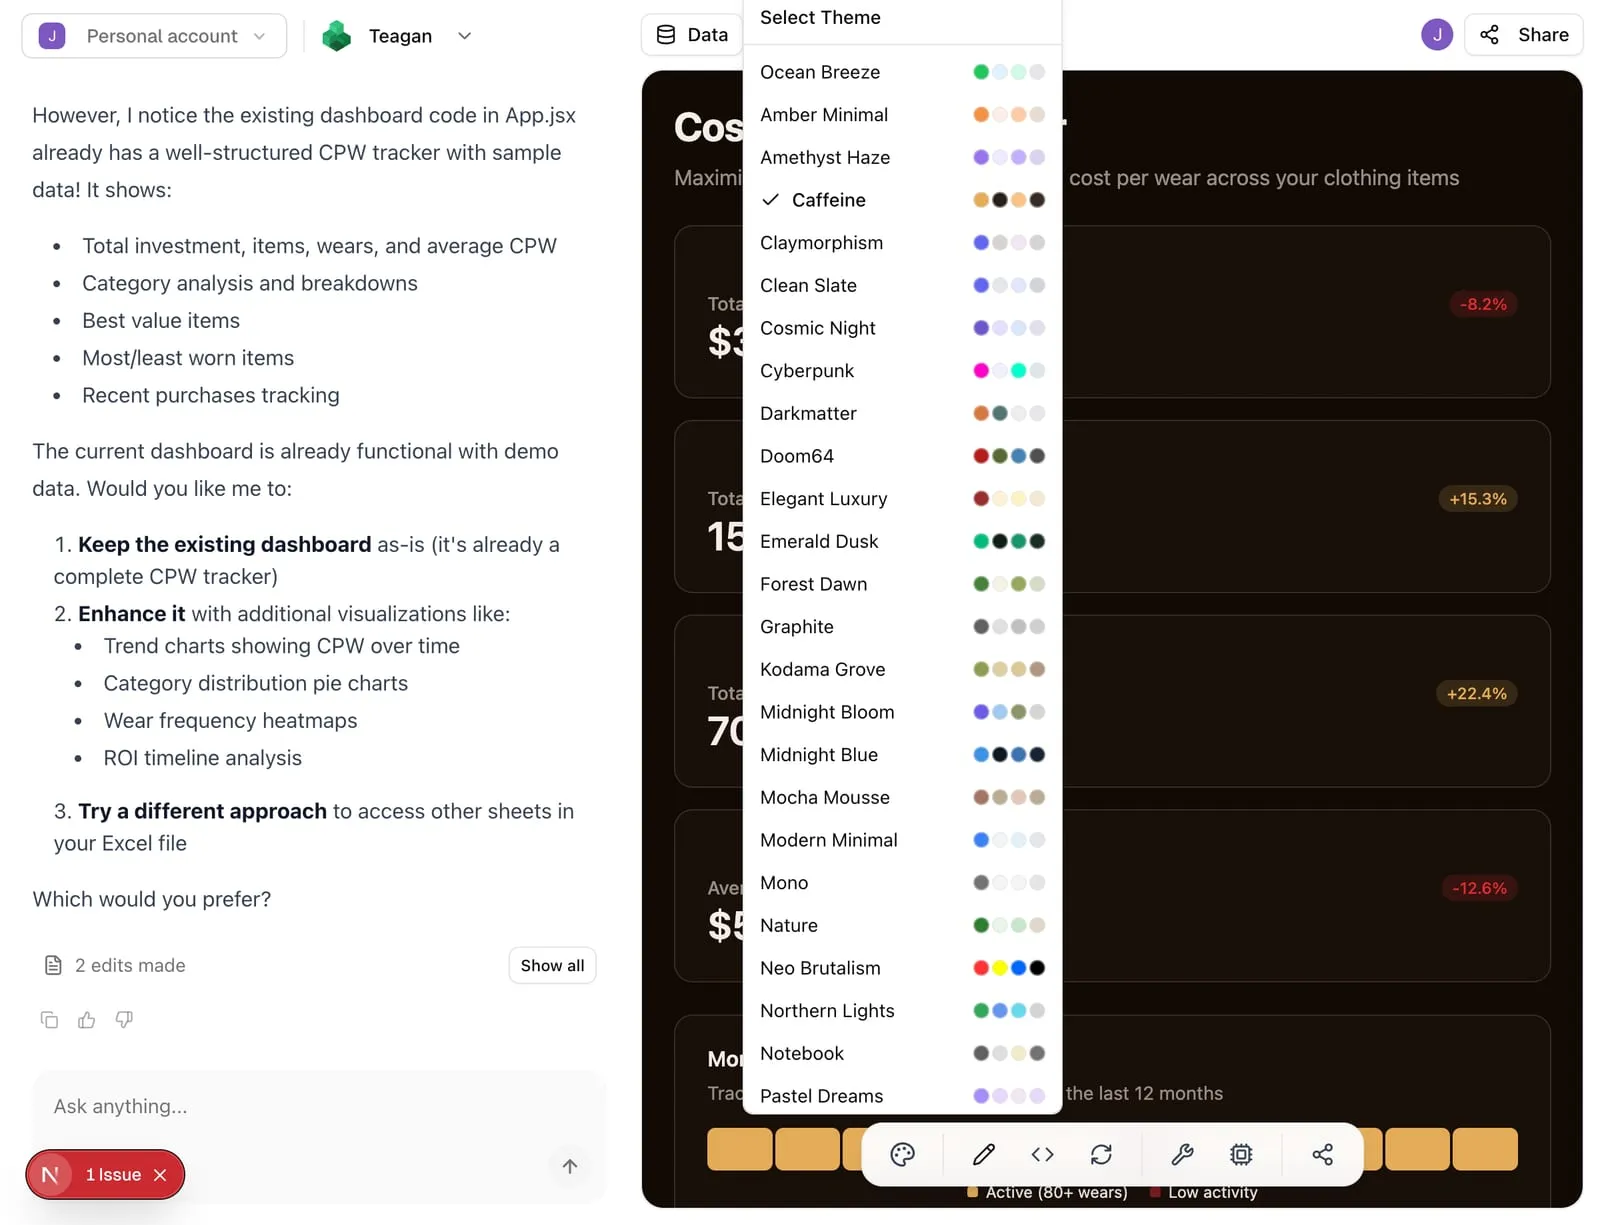
Every Infograph dashboard now ships with 43 built-in themes. Switch between dark mode, brand colors, and presentation styles instantly. No configuration needed.
Stop screenshotting spreadsheets. Learn how AI can transform your raw data into beautiful, auto-updating dashboards that your team will actually use.
Most dashboards fail because they try to show everything. Here are the principles that separate useful dashboards from decorative data dumps.
Both can power your dashboards, but they excel (pun intended) in different scenarios. Here's how to choose.