Guide
How to Build an Operations Dashboard (Without a Data Team)
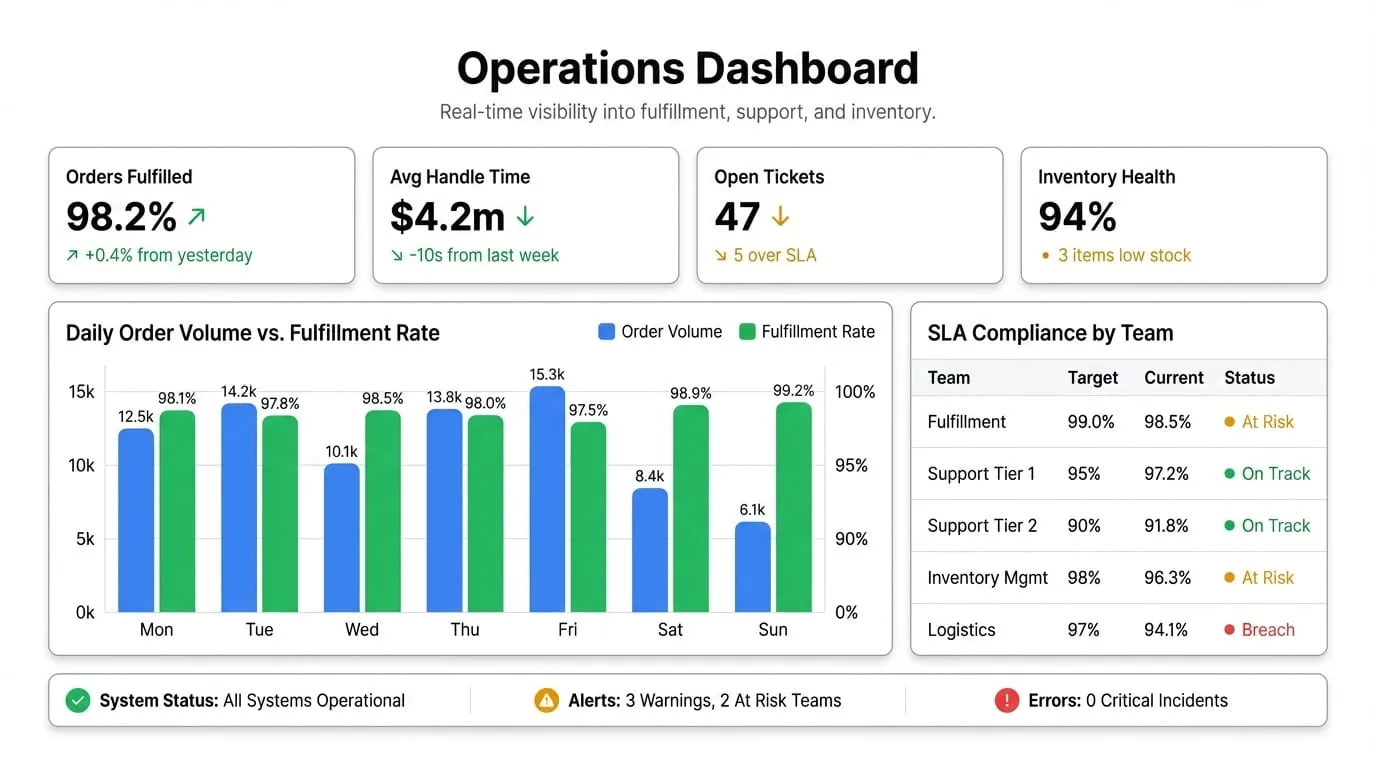
An operations dashboard gives you real-time visibility into the metrics that keep your business running — fulfillment, support, inventory, SLAs — without waiting on a data analyst.
An operations dashboard gives you real-time visibility into the metrics that keep your business running — fulfillment, support, inventory, SLAs — without waiting on a data analyst.
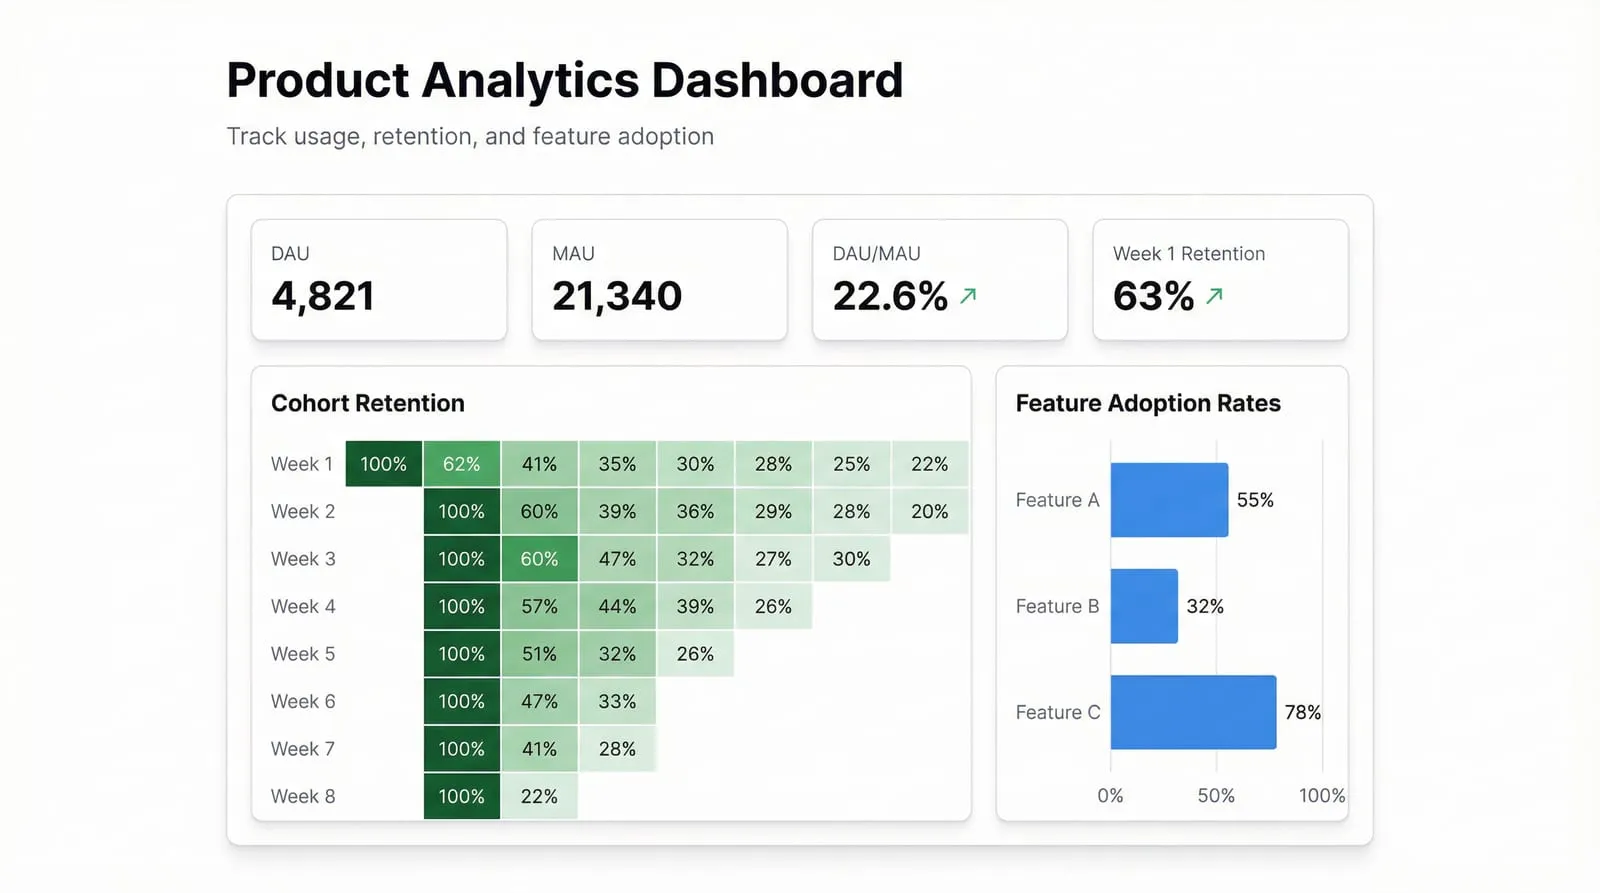
Build a product analytics dashboard that shows you DAU, retention curves, and feature adoption — without waiting on your data team. Connect your data and get answers in minutes.
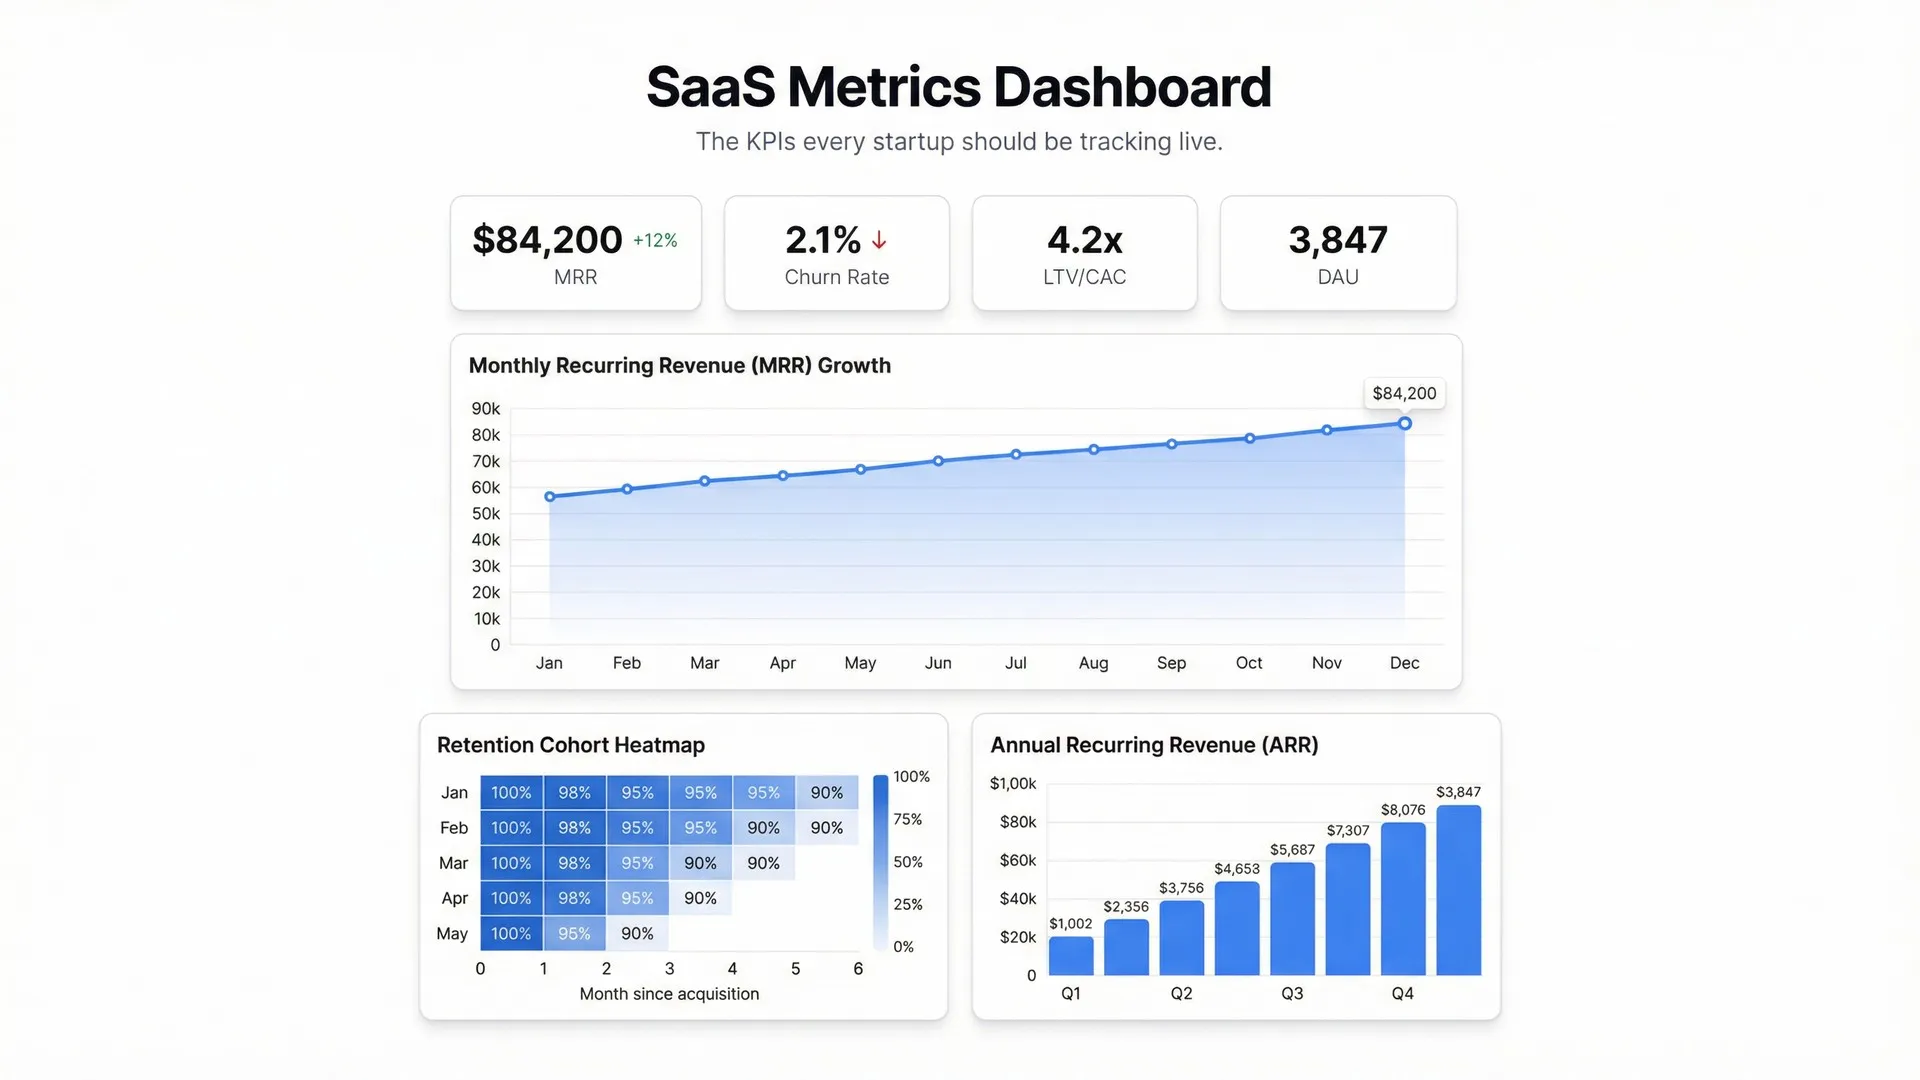
MRR, churn, ARR, LTV/CAC, DAU — the metrics that define a SaaS business. Here's how to pull them from your spreadsheets into a live dashboard that actually tells you where you stand.
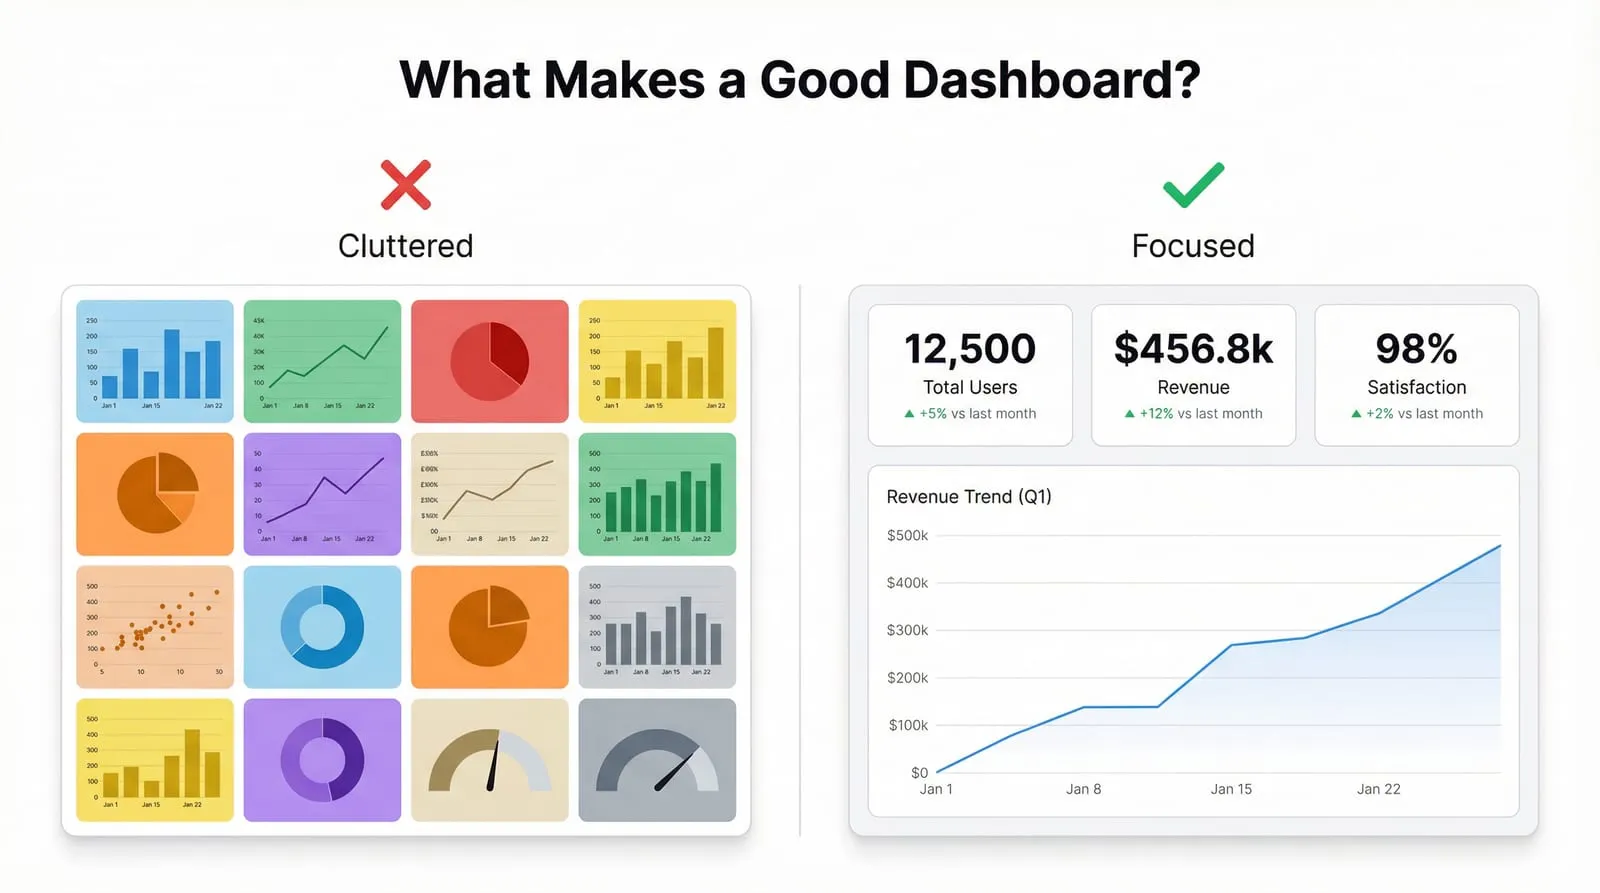
Most dashboards show everything and help with nothing. Here's what separates dashboards that drive decisions from ones that just look busy.
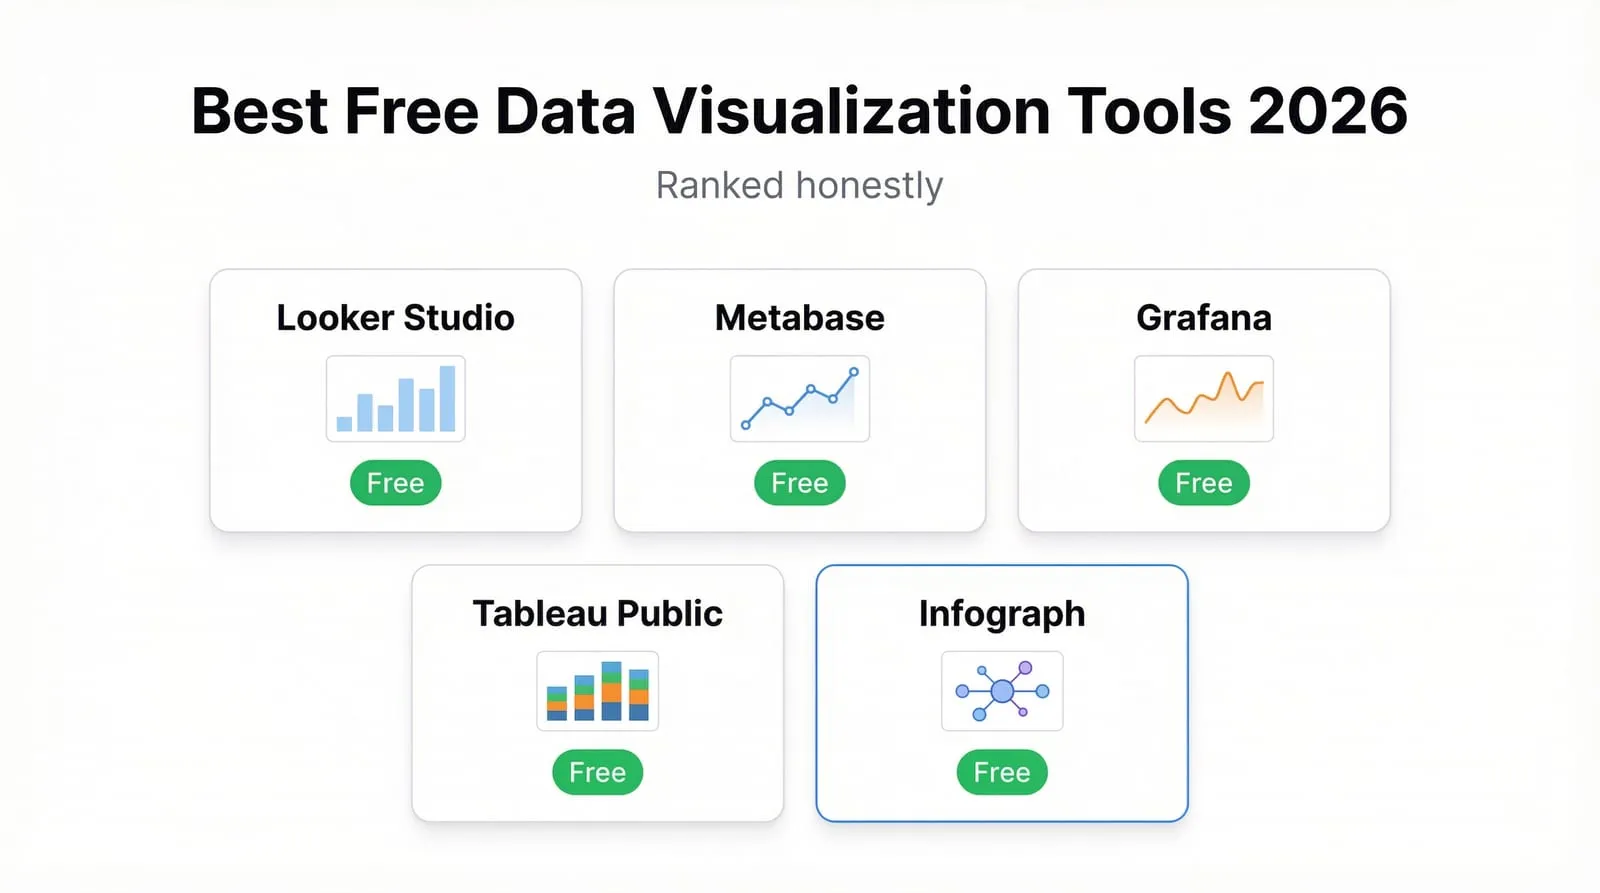
Tableau is expensive. Power BI has a learning curve. Here are the free data visualization tools that are actually worth your time.

The fastest way to build a great dashboard is to start with one that already works. Here are 12 data dashboard examples across different functions — and how to build each one.
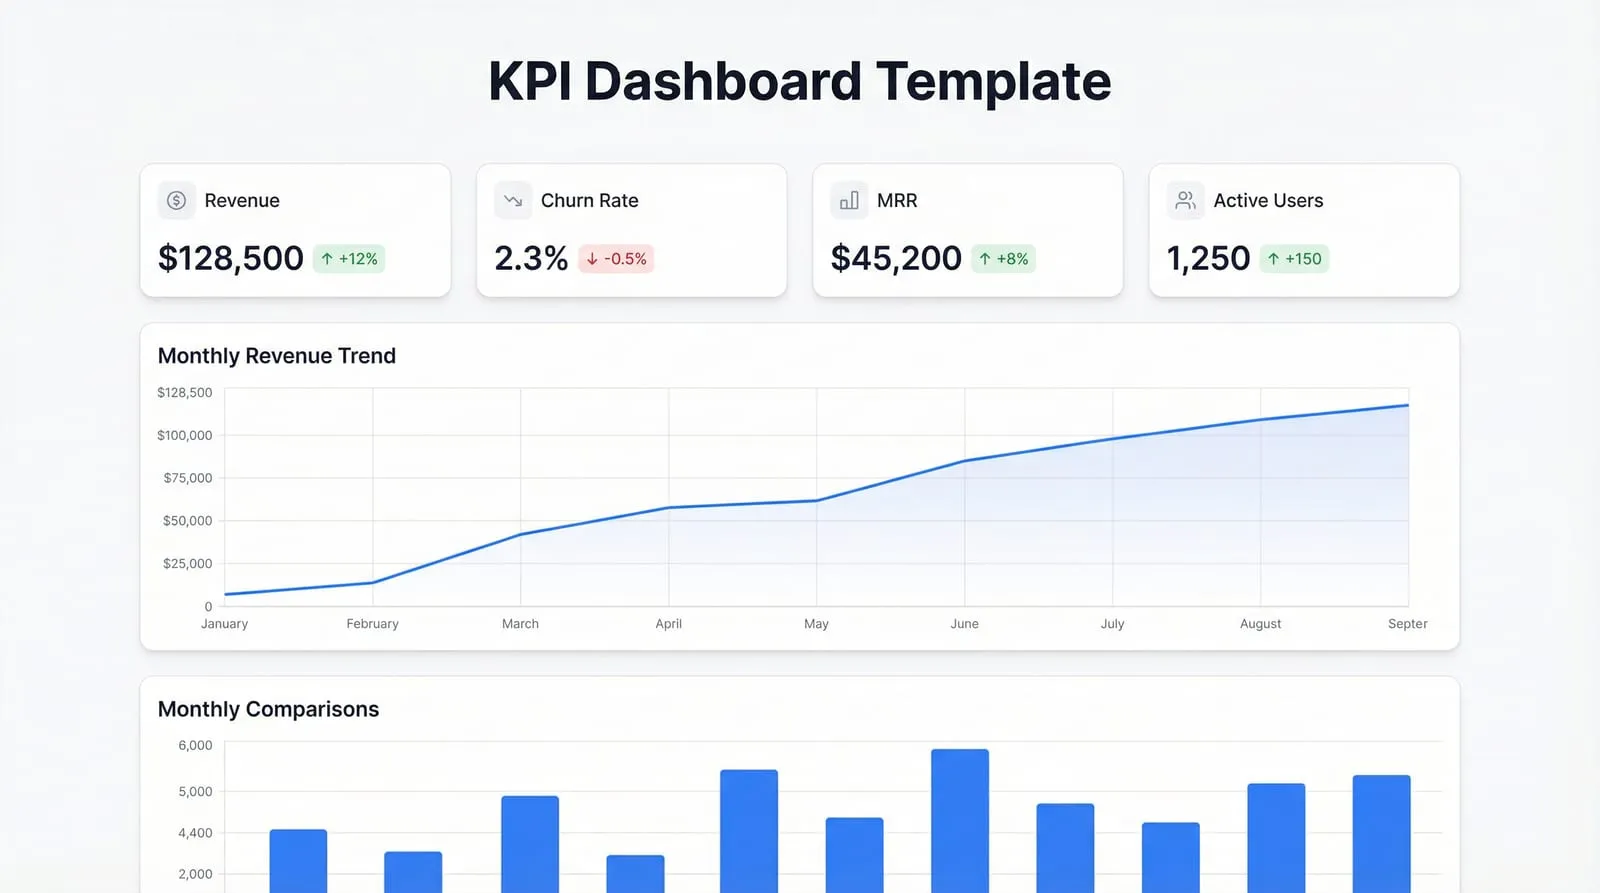
Stop building KPI dashboards from scratch. Here are the best free templates — plus how to skip templates entirely with AI.
An executive dashboard has one job: give leadership a clear picture of business health in under a minute. Most don't. Here's what one should actually show and how to build it.
The best HR dashboards don't just report headcount — they surface the trends that matter: attrition risk, hiring velocity, engagement, and cost per hire. Here are real examples and how to build yours.
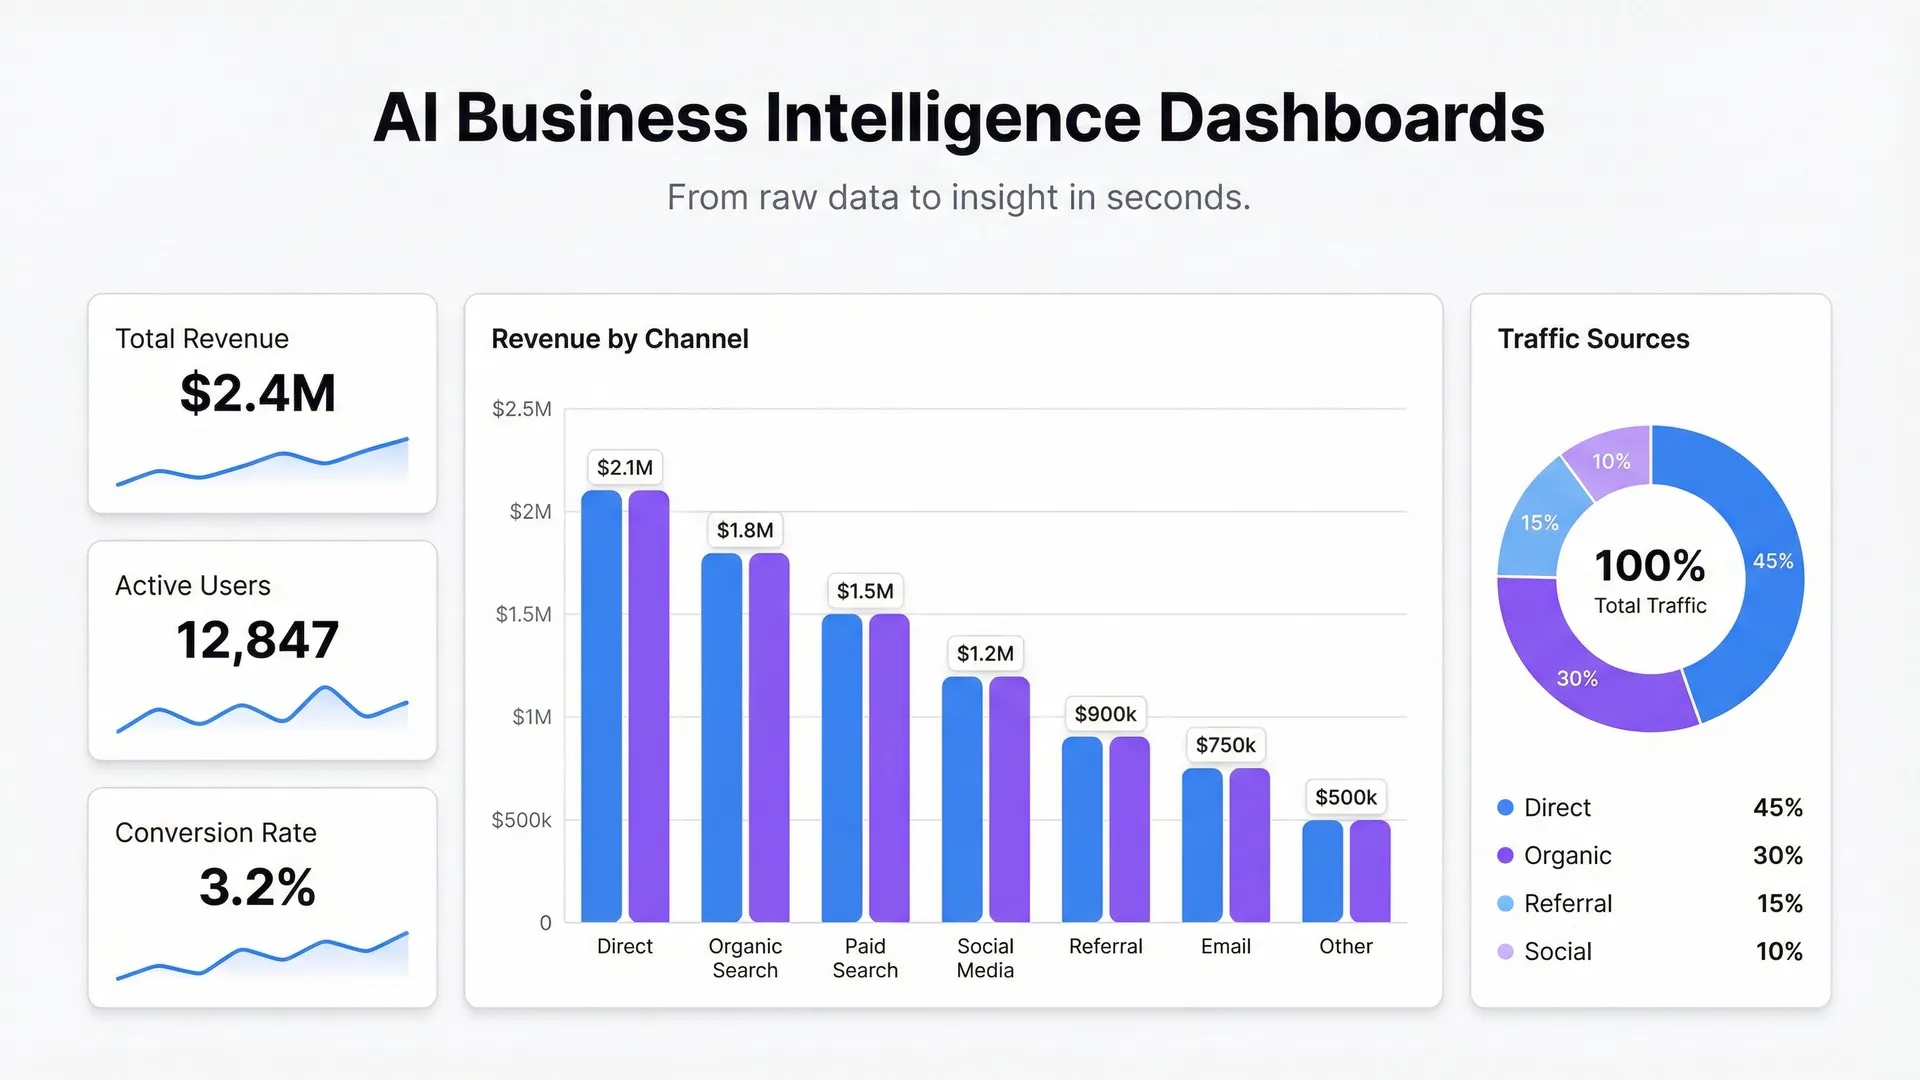
Traditional BI tools weren't built for teams that need answers now. AI-powered BI dashboards are changing how companies explore data. Here's what's actually changed and what to use.
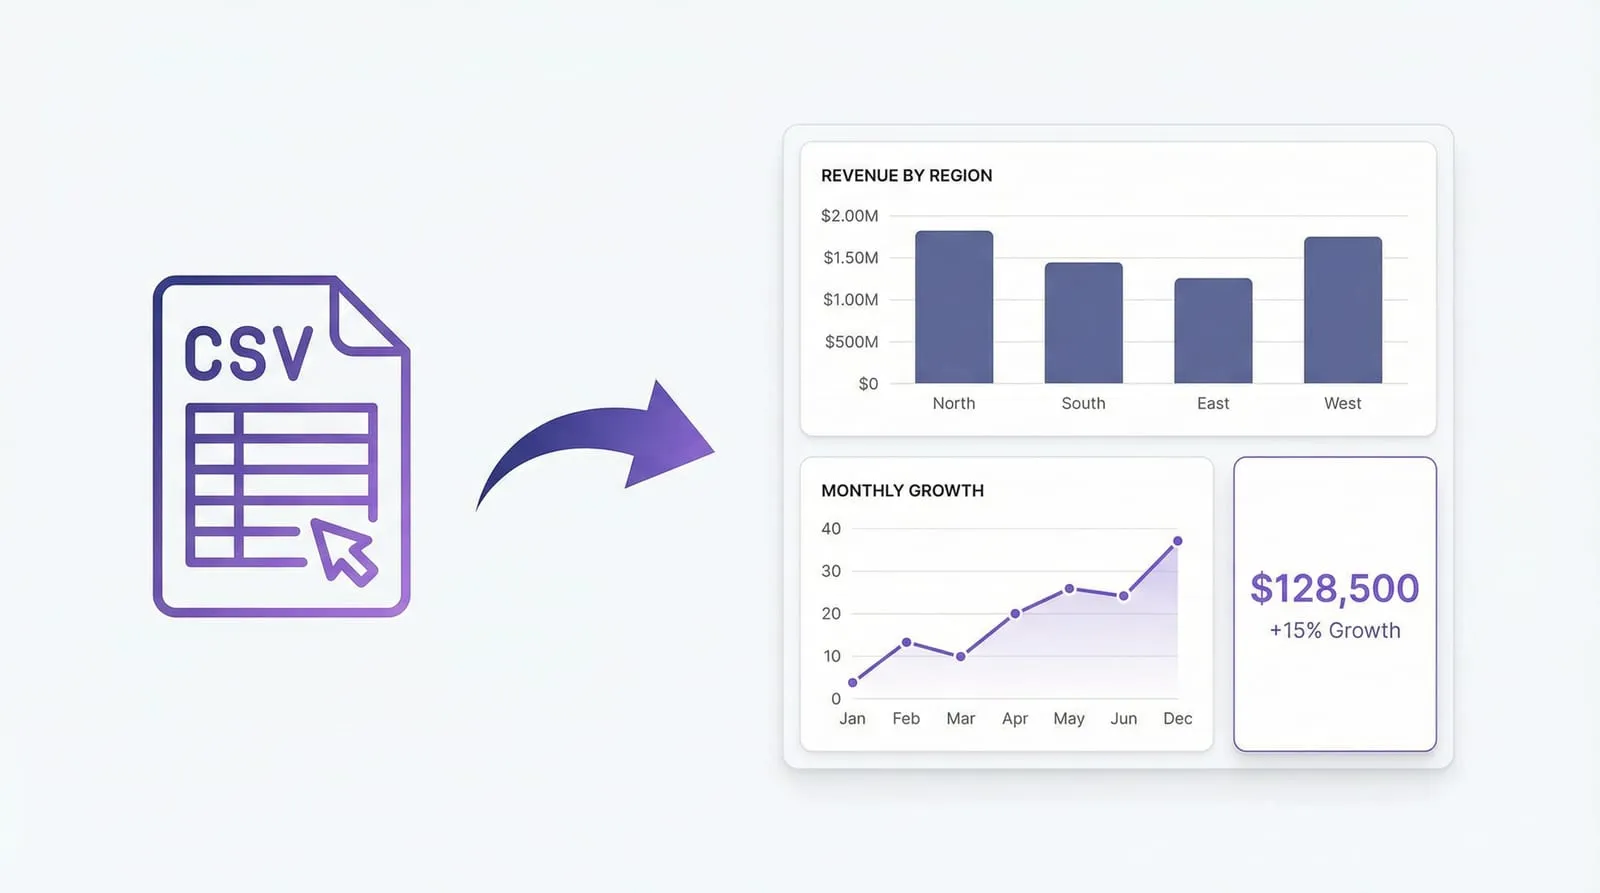
Got a CSV? Turn it into a shareable, interactive dashboard without writing a line of code. Here's exactly how to do it with Infograph — free, no credit card required.
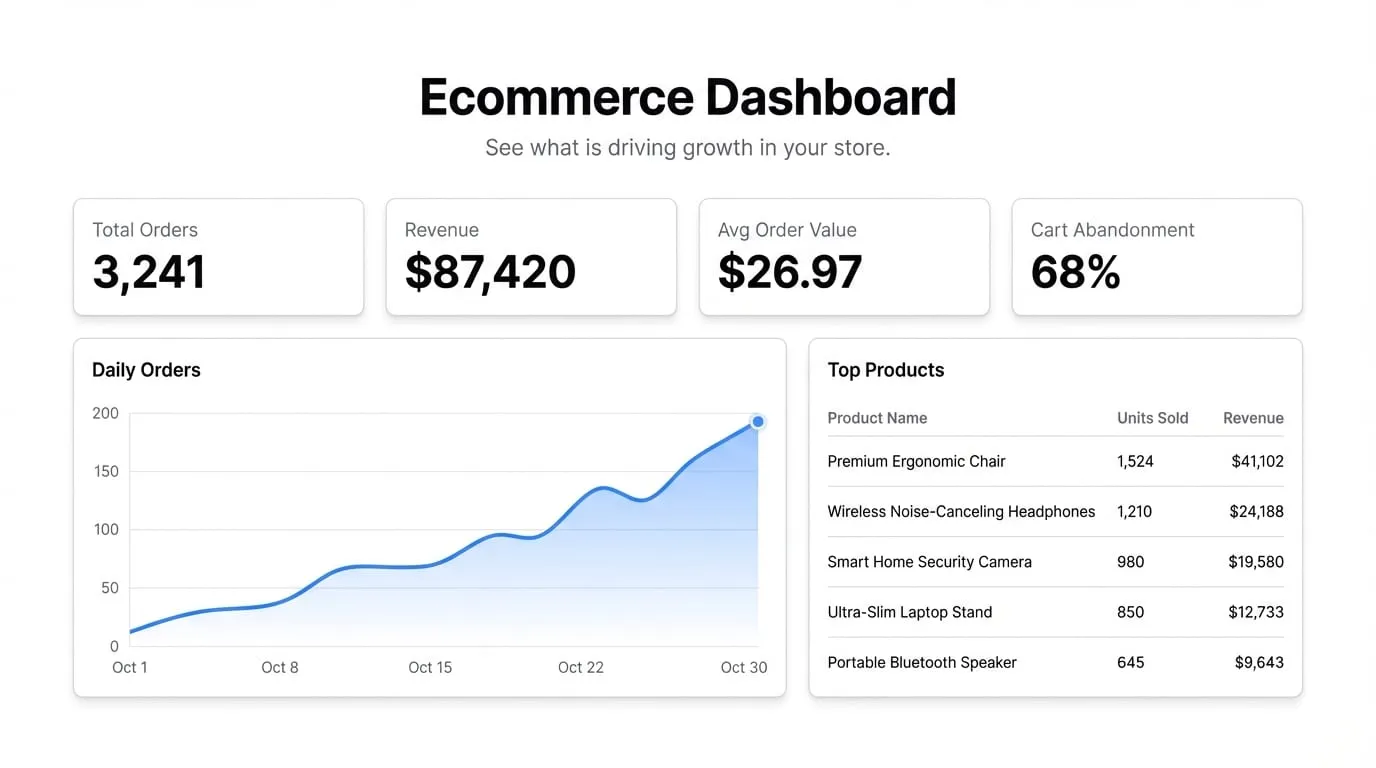
Your Shopify or WooCommerce store generates more data than you can read in a report. Here's how to build an ecommerce dashboard that shows what's actually driving growth.
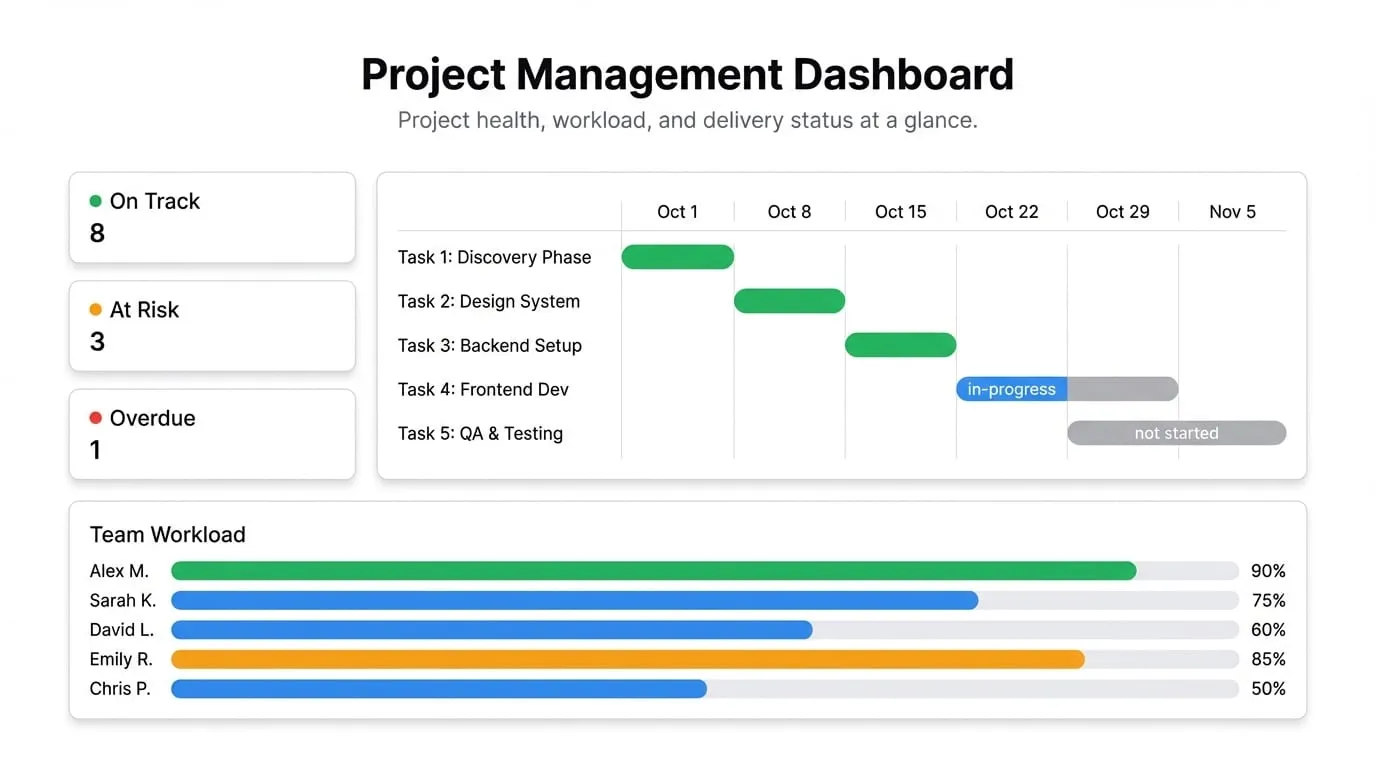
Project management tools give you data but rarely a clear picture. Here's how to build a dashboard that shows project health, team workload, and delivery status at a glance.