Built with Infograph
QuickBooks Dashboard: Who Pays Late and When the Cash Lands
A QuickBooks dashboard that shows how long each customer really takes to pay, who is getting slower, and when the money you're owed will actually arrive.
Highlights
Every customer against their own terms
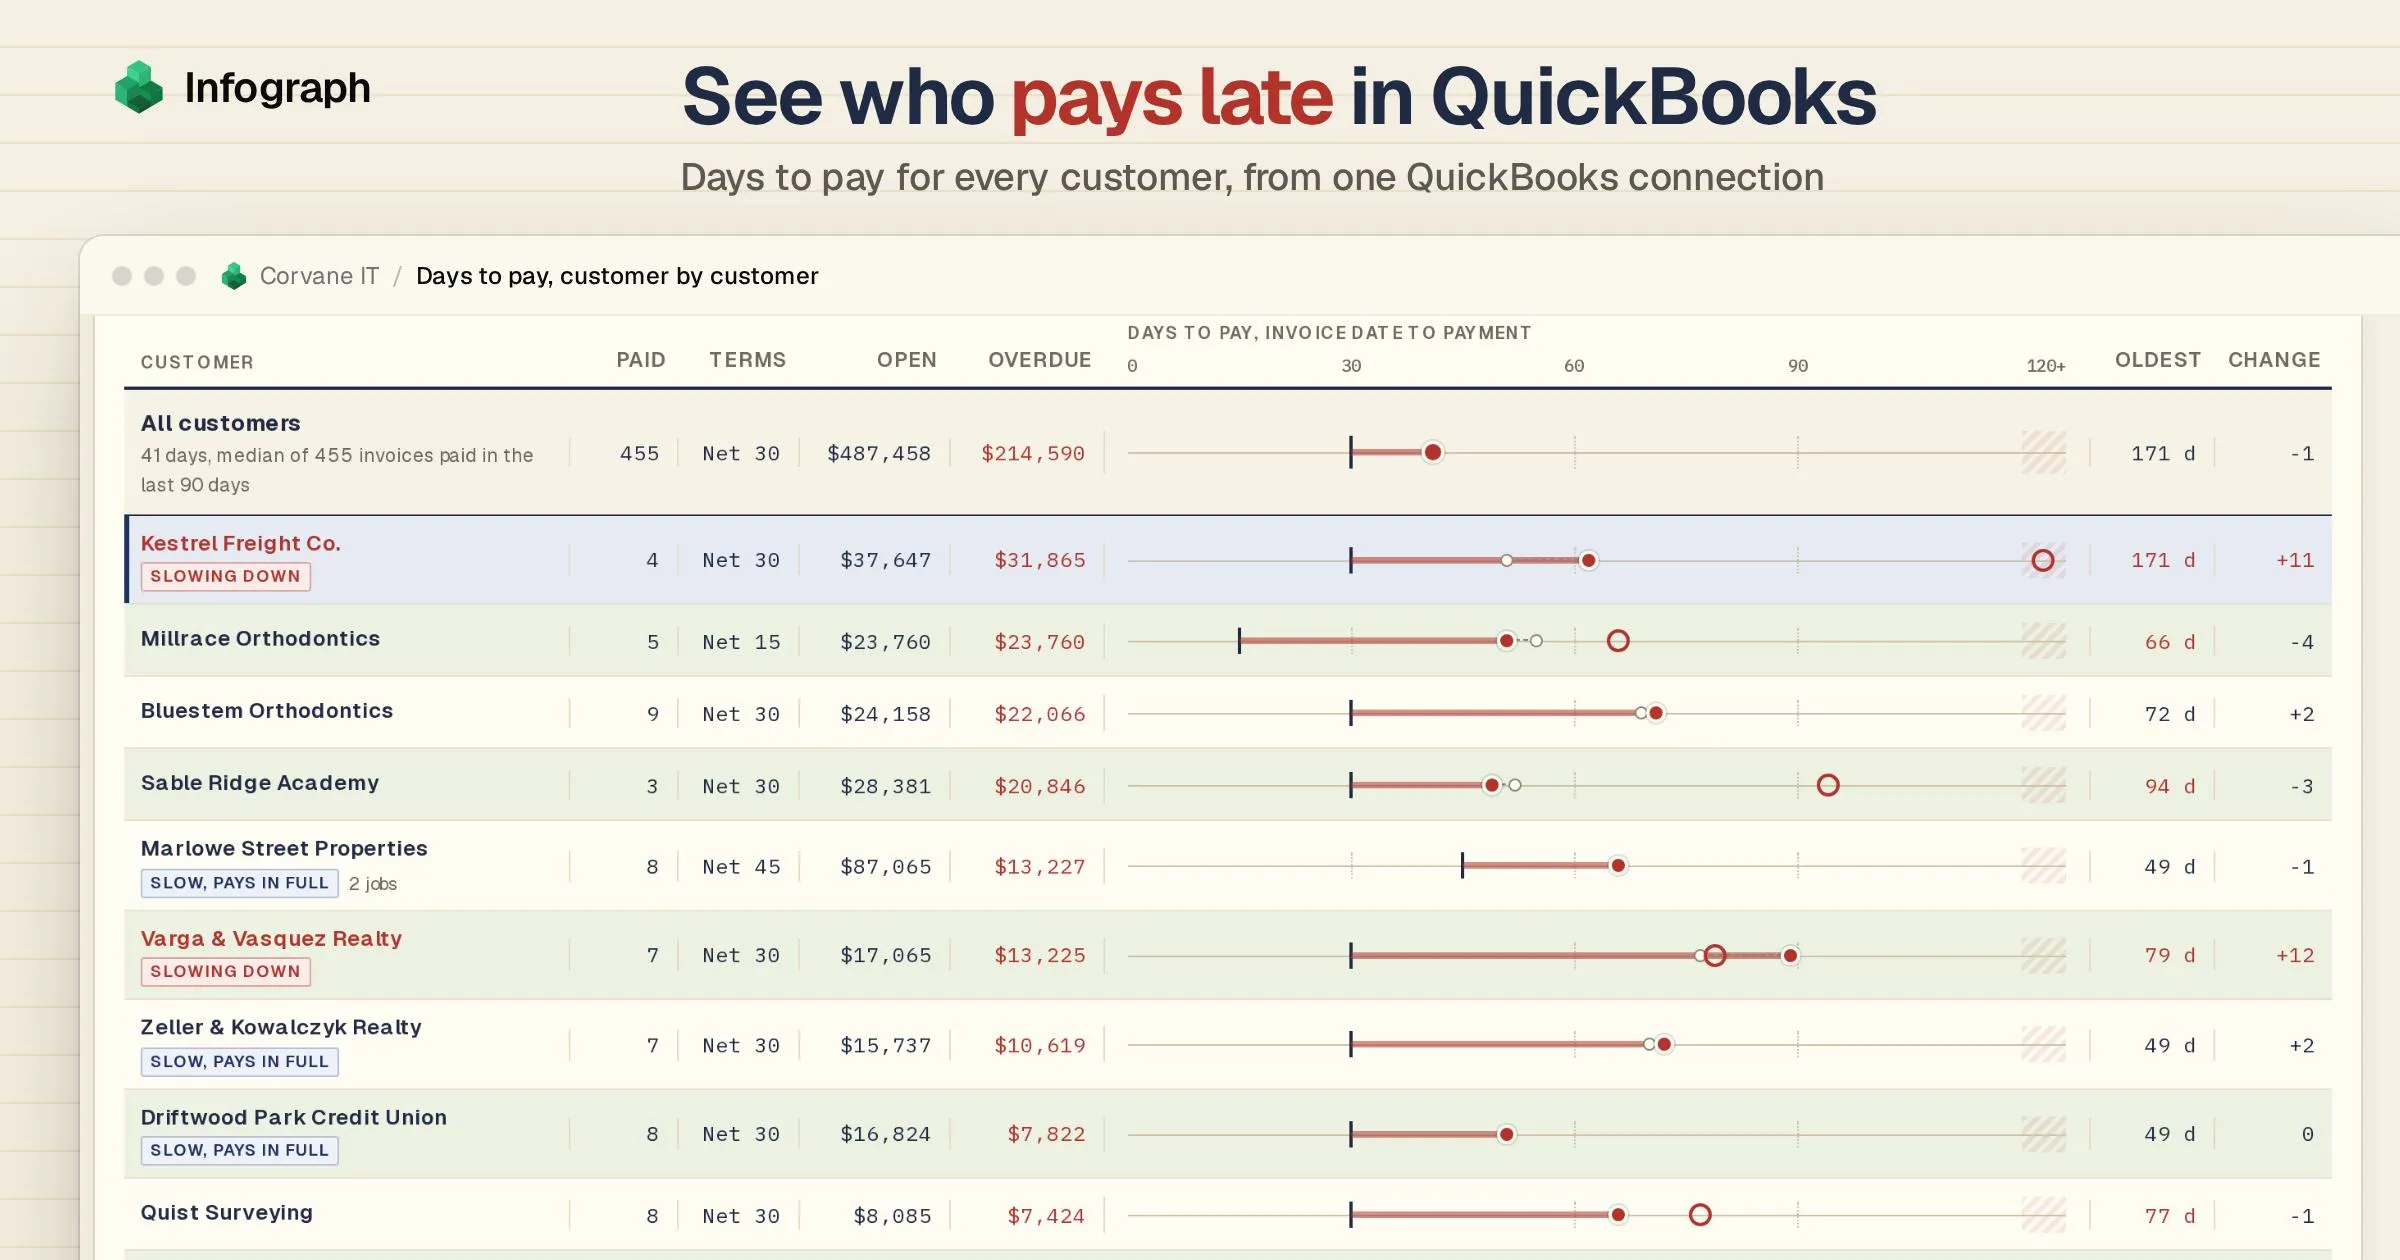
The black tick is a customer's terms, the dot how long they took to pay over the last 90 days. 48 of the 73 customers who paid in that time usually paid later than their terms.
A customer slowing down, flagged
Kestrel Freight's dot moved from 51 to 62 days in a quarter. The red ring is its oldest unpaid invoice, sent 171 days ago.
Slow, but pays in full
Marlowe Street Properties takes about 66 days on Net 45, year in, year out, and none of its unpaid invoices is more than 4 days past due. Plan around it rather than chase it.
Key takeaways
- See how long each customer really takes to pay. QuickBooks Online has no report for it. In our sample company, where most customers are on Net 30 terms, invoices were paid in a median of 41 days over the last 90 days, and only 31% by their due date.
- Spot a slowing customer months before the aging report does. Five customers owe $111,764 of the $214,590 that’s past due. The dashboard’s 90-day view would have tagged one of them, Kestrel Freight, as slowing down at the end of May: four months before its first unpaid invoice reached the over-90 column of QuickBooks’ aging report.
- Plan this week’s cash on how customers pay. Count overdue invoices as due now and $222,976 arrives this week. Leave them out, as QuickBooks’ own cash flow planner does, and only $8,386 does. Each customer’s own track record says $61,263.
Made with Infograph
Connected the data
Built the dashboard
Turned two years of QuickBooks invoices and payments into days to pay for every customer, a chase list and an eight-week cash forecast
Shared with your team
Send a link, or work on it together in your account
Connect your apps and databases. Infograph builds live, interactive dashboards for you and your team.
No credit card required
A QuickBooks dashboard is a page of charts and numbers built from your QuickBooks data. QuickBooks Online has one of its own, the home screen with your bank balances. The one in this post is built in Infograph, and it’s about the money customers owe you: how long each of them takes to pay, who is getting slower, and when that money will reach your bank.
Your invoices say Net 30: the customer should pay within 30 days of the invoice date. Days to pay is how long they actually took, from the invoice date to the day the money arrived. QuickBooks Online can tell you who owes what today, in its A/R aging report. A/R is accounts receivable, the money customers owe you, and the aging report sorts it by how late it is. What it can’t tell you is how each customer usually pays. Intuit’s own help page says QuickBooks Online “doesn’t have a report on how long customers usually take to pay invoices”.
We built this dashboard in Infograph, where you connect apps like QuickBooks and ask for dashboards in plain words. Infograph copies your QuickBooks data across on a schedule, which it calls a sync. Every payment in QuickBooks records which invoices it paid, so Infograph can find the day each invoice was settled.
We walk through it with Corvane IT, a made-up IT support company of 24 people in Denver with about a hundred clients. Its invoices and payments are sample data in exactly the shape Infograph syncs from QuickBooks Online, so everything here can be built from a real company. Open the sample dashboard to click through it as you read.
- Past its due date: 44% of everything customers owe Corvane
- $214,590
- Source: This sample dashboard, at the last sync
- Owed on invoices already later than their customer usually takes to pay: the money to chase
- $83,272
- Source: This sample dashboard, at the last sync
What the QuickBooks dashboard reads
Everything comes from one QuickBooks Online connection:
QuickBooks. Every invoice, payment and credit memo (a credit you give a customer against what they owe), and the bills you owe suppliers. A payment in QuickBooks names the invoices it paid, so the dashboard knows the day each invoice was settled, even when one payment covers a month of invoices or an invoice is paid in two parts. How to connect QuickBooks.
One Infograph dashboard, kept up to date from QuickBooks.
Terms come from the invoices themselves: the due date minus the invoice date. You don’t need to keep a list of who is on which terms.
How to read your QuickBooks dashboard
The dashboard opens on the last 90 days, because that shows how customers pay now. Switch to 12 or 24 months for steadier figures.
Start with the totals
The numbers across the top come first. Corvane is owed $487,458 on 226 invoices, and $214,590 of it is past its due date.
Days to pay comes next. Over the last 90 days, the median invoice was paid 41 days after it was sent. The median is the middle invoice: half were paid faster and half slower, so one invoice paid a year late can’t drag it. Most of Corvane’s customers are on Net 30, so 41 days is 11 days late, and only 31% of invoices were paid by their due date. The Net 30 customers on their own took 44 days: you can pick them out with a button on the customer table further down.
Find who pays late, customer by customer
The customer table, which the dashboard draws as a ledger (it’s the big table on the cover), has one row per customer, sorted by how much they owe past the due date. The ruler on each row runs from 0 to 120 days.
The black tick is the customer’s terms. The dot is how long they took to pay over the last 90 days, and the red line from tick to dot is how late that is. Most dots sit to the right of their tick: 48 of the 73 customers who paid Corvane in the last 90 days usually paid later than their terms.
Two more marks show what an average misses. The small hollow dot is where the customer was in the 90 days before, so you can see who is moving. The red ring is the customer’s oldest unpaid invoice. It only appears when that invoice is older than the customer usually takes to pay. A median only counts invoices that were paid, so it can’t see one that’s still sitting there, but the ring can.
Five customers owe $111,764 of the $214,590 past due. Not all of them are a worry. Marlowe Street Properties, a property manager on Net 45 terms, has paid in about 66 days for a year, and none of its unpaid invoices is more than 4 days past due. The dashboard tags it “Slow, pays in full”. Plan on its money arriving about 66 days after each invoice, not 45, and save your calls for someone else.
The buttons above the ledger filter it by terms, such as Net 30 or Net 45, and you can sort it by who is slowing down most.
Spot a customer slowing down
Click a row to open the customer’s account below the ledger. Kestrel Freight, a logistics company, is the one to look at in our sample. Its invoices took a median of 51 days to be paid in one 90-day stretch, and 62 in the next. The dashboard tags it “Slowing down”.
The chart shows every Kestrel invoice of the last year as a line, from the day it was sent to the day it was paid. Blue is the time before the due date and red is the time after it. Through the winter the lines are short, with small red ends. From April they grow longer and redder. Seven invoices from June and July were never paid. Their dashed lines run on to today, and together they come to $18,608, all of it now more than 90 days late.
The note on the oldest of them was typed into QuickBooks by whoever chased it: “Promised after their Q3 close. Chased 2 Oct, 23 Oct.” In other words, Kestrel said it would pay once its third-quarter books were done.
This is the payoff. QuickBooks’ aging report only puts an invoice in its over-90 column once it’s 90 days past due, so Kestrel first showed up there at the end of September. Had you looked at the end of May, the same 90-day view would already have tagged Kestrel as slowing down: its median had gone from 32 days to 43. That’s four months to talk to Kestrel before the money was seriously late.
The tag compares the last 90 days with the 90 before, so it belongs to the 90-day view. Over 12 months, Kestrel’s good winter months pull its median back to 39 days, and the tag doesn’t show.
Plan this week’s cash on how customers pay
This chart places every open invoice in the week its customer will most likely pay it. To do that, it adds the customer’s usual time to pay to the invoice date. “Usual” means their median over the last 12 months, a longer stretch than the ledger’s 90 days, so one odd month doesn’t swing the forecast.
The dashed outlines show the same invoices by due date. A forecast from due dates has nowhere to put an overdue invoice, so it counts it as arriving in the first week.
The difference shows in week one. Count every overdue invoice as due now, as this chart’s outlines do, and $222,976 should arrive this week. Leave overdue invoices out, as QuickBooks’ own cash flow planner does, and only $8,386 is due. Neither is what happens. By each customer’s habit, $61,263 will arrive this week, and the rest of the overdue money spreads over the weeks after.
Some of it can’t be placed at all. An invoice that’s already later than its customer usually takes has no likely week, so it’s left out. That’s $83,272, and it makes the chase list below. For a customer who is slowing down, like Kestrel, even the habit is generous, because a 12-month median still remembers the good months.
Bills you owe sit below the line, from the bills entered in QuickBooks. In the week from 3 December, $63,193 falls due, most of it one supplier’s bill for hardware Corvane installed for Marlowe. Corvane billed Marlowe $46,380 for it on Net 45, and Marlowe usually takes about 66 days, so that money should arrive in mid-January. Corvane pays its supplier about five weeks before Marlowe pays Corvane.
Payroll isn’t a bill in QuickBooks, so it isn’t on the chart. Keep your own pay dates in mind when you read it.
Work through the chase list
The invoices left out of the forecast make the chase list: $83,272 on 28 invoices, biggest first. The middle column says how many days each one is past its customer’s usual time to pay.
Sable Ridge Academy’s $15,500 is at the top. Open its account and the QuickBooks note explains why: the invoice is disputed, and a meeting is booked. Kestrel has nine invoices on the list, $24,390 in all: the seven old ones and two from October. Its four biggest are in the top seven, so one call covers them.
Before you pick up the phone
Match the payments that already arrived
An unapplied payment is money a customer has sent that nobody has matched to an invoice in QuickBooks yet. Until someone does, the invoice still looks unpaid, and you could chase a customer who has already paid. Corvane has four, worth $8,857, and the chase list names those customers so you can check first.
Watch the aging report month by month
QuickBooks’ A/R aging report shows one date at a time. This chart rebuilds it at the end of every month for two years, from the invoices and the payments made before each date.
The red band is money more than 90 days late. At the end of October it was $17,768, and all of it was Kestrel’s. It’s $18,608 today, because another Kestrel invoice crossed 90 days in November.
The last time the band was this big, from November 2025 to January 2026, it was an events company that had stopped paying. In February Corvane gave up and wrote off the $19,723 it owed as a bad debt: that’s why the band disappears. Kestrel owes about as much now.
Days sales outstanding, or DSO, is the measure accountants often use for the same worry. It counts what customers owed at the end of a month in days of sales, so it includes invoices nobody has paid yet. It jumps around from month to month, so compare averages: Corvane’s averaged 33.9 days in its first three month ends and 38.9 in its last three. Because the chart is rebuilt from today’s data, a month can differ a little from what QuickBooks showed at the time, if an old invoice has been edited since.
Test online payment on your slowest payers
QuickBooks lets you switch on card and bank payment for each invoice. Over the last 90 days, invoices with it switched on were paid in a median of 39.5 days, against 44 without.
Customers who pay quickly may simply be the ones who say yes to paying online, so that alone proves nothing. A fairer test compares customers with themselves: the 14 customers who paid both ways over two years paid a median of 7.3 days faster when it was on. To find out for your own customers, switch it on for your ten slowest payers for a quarter and watch their dots.
What to do with what you see
The dashboard tells you where to spend your Monday. For Corvane, that means:
- Call the chase list first, biggest and oldest first, and match any unapplied payments before you dial.
- Talk to a customer who’s slowing down before you send the next invoice. Shorter terms, a deposit, or a pause on new work until the old invoices are paid are all on the table, and Kestrel is the one to call.
- Plan around slow but steady customers rather than chasing them: count on Marlowe’s money 66 days after each invoice, not 45.
- Ask for a deposit on big purchases you make for a client, like the hardware Corvane bought for Marlowe, so you aren’t paying your supplier five weeks before your client pays you.
- Watch your cash gap, the time between paying your suppliers and getting paid. Corvane pays its suppliers in 15 days and waits 41 for its customers, so it carries 26 days of billing out of its own cash.
Should you use QuickBooks’ own reports instead?
For some jobs, yes.
- The aging report (A/R Aging Summary in QuickBooks Online’s reports) is the quickest answer to who owes what today.
- Exporting to Excel works for a one-off look, which is what Intuit’s help page suggests. Our guide to average days to pay has the formulas, and the traps, such as one payment that covers several invoices.
- QuickBooks’ cash flow planner forecasts your bank balance from your accounts and your open invoices and bills. Its FAQ says it leaves overdue invoices out unless you add them back. For a quick look ahead inside QuickBooks, start there.
- Power BI, Microsoft’s reporting tool, used to have its own link to QuickBooks Online. Microsoft retired it in 2025, and it no longer appears in Microsoft’s list of connectors.
This dashboard puts each customer’s days to pay, who is slowing down, the forecast by habit and the chase list on one page, updated from QuickBooks every time it syncs.
Build a QuickBooks dashboard from your own company
Connect QuickBooks Online
Sign in with Intuit and choose the company. Only the company’s primary admin or a Company admin can connect apps, so if you’re a standard user, ask one of them. QuickBooks Desktop doesn’t connect, and each company is its own connection. The connection guide covers the rest.
Choose what to sync
Back in Infograph, pick Invoices, Payments, Customers, Credit notes (QuickBooks’ credit memos), Bills and Bills paid. The first sync brings everything changed in the last two years.
Ask Infograph for the dashboard
Tell Infograph what you want to know, in plain words, something like the request below. Choose the extras that fit how you work.
Every Monday I need to know who to chase, and whether the money coming in covers the bills going out. Use my QuickBooks invoices, payments and bills. Show how long each customer takes to pay against their own terms (each invoice’s due date minus its date), over the last 90 days, 12 months or 24 months, and flag anyone who is getting slower. Mark each customer’s oldest unpaid invoice when it’s older than they usually take, and let me click a customer to see every invoice from issue to payment. Count an invoice as paid on the date of the payment that cleared it, and leave out credits, write-offs and voided invoices. List the open invoices already later than their customer usually pays, biggest first. Then show when the money I’m owed will arrive over the next eight weeks, using each customer’s own habit rather than the due date, against the bills due.
One QuickBooks connection works on the Free plan, where you press Sync to refresh. Plus syncs every day and Pro every 30 minutes (see the plans).
QuickBooks dashboard questions
What is average days to pay?
How long customers take to pay an invoice, from the invoice date to the day the payment arrives. This dashboard uses the median, the middle invoice, rather than the plain average, so one very late invoice can't skew it. Our guide to average days to pay has the formulas if you want to work it out in Excel.
How is days to pay different from DSO?
Days to pay looks at invoices that were paid and asks how long each took. DSO, days sales outstanding, looks at what is still owed at a month end and compares it with recent billing, so it includes invoices nobody has paid yet. Days to pay tells you about each customer. DSO tells you about the business as a whole.
Does QuickBooks Online have a days to pay report?
No. Intuit's help page says QuickBooks Online doesn't have a report on how long customers usually take to pay invoices, and suggests exporting a similar report to Excel or using an app from the QuickBooks App Store.
How does it handle partial payments, credits and write-offs?
An invoice paid in parts counts as paid on the date of its last payment. One payment that covers several invoices settles each of them on that day. Credit memos and write-offs (debts you've given up on) aren't cash, so an invoice closed mostly by a credit is left out of days to pay, and so are voided invoices.
What if I record payments without matching them to invoices?
Then QuickBooks still shows those invoices as unpaid, and so does the dashboard, because an unapplied payment isn't linked to any invoice. Match it to its invoices in QuickBooks and the next sync picks it up. The chase list names customers with unapplied payments so you can check first.
How much history will I see?
The first sync brings every invoice, payment and bill changed in the last two years. Later syncs add what changes. An invoice that has sat untouched for more than two years isn't included.
Which plan do I need?
One QuickBooks connection fits the Free plan, where you press Sync before you look. Plus syncs every day, and Pro and Teams every 30 minutes. See the plans at infograph.ai/#pricing.
Who can see my QuickBooks data?
Your synced data is stored encrypted, in storage that belongs to your Infograph account, and what you build is private to your account until you share or publish it.
Does it send payment reminders?
No. Infograph only reads your QuickBooks data, so reminders still go out from QuickBooks or from you. The dashboard tells you who to chase and which invoice to start with.
Can Infograph change anything in QuickBooks?
No. Intuit's sign-in asks you to allow access to the company's accounting data, and Infograph only reads it. It never creates or edits an invoice, payment or bill.
Can I ask Claude about my QuickBooks data?
Yes. Infograph has an MCP server, the standard way AI assistants such as Claude plug into other apps. Add it to Claude and you can ask about your synced QuickBooks data, such as which customers have slowed down this quarter, and Infograph works out the answer across all your invoices.
Does it work with QuickBooks Desktop?
No. Infograph connects to QuickBooks Online. Each QuickBooks Online company is its own connection.
Will the prompt build exactly this page?
No. It builds your own version from your company, and the layout may differ. This sample was built in Infograph with more care over the look than the first version Infograph builds will have, and you can keep asking for changes until it suits you.
I'm having trouble connecting QuickBooks
The guide covers each step and the errors you might see, such as signing in as a user who isn't an admin of the company:
Is Corvane IT a real company?
No. It is a made-up IT support company, with two years of invoices, payments and bills generated in exactly the shape Infograph syncs from QuickBooks Online, so every panel on this dashboard can be built from a real company.