Data report
Anthropic IPO Price: IPOs Priced Above Their Range Averaged a 50% First-Day Jump
Anthropic priced at $83, above its range. IPOs priced that way have risen 50% on day one on average. Shares bought at that day's close have lagged the market.
Key takeaways
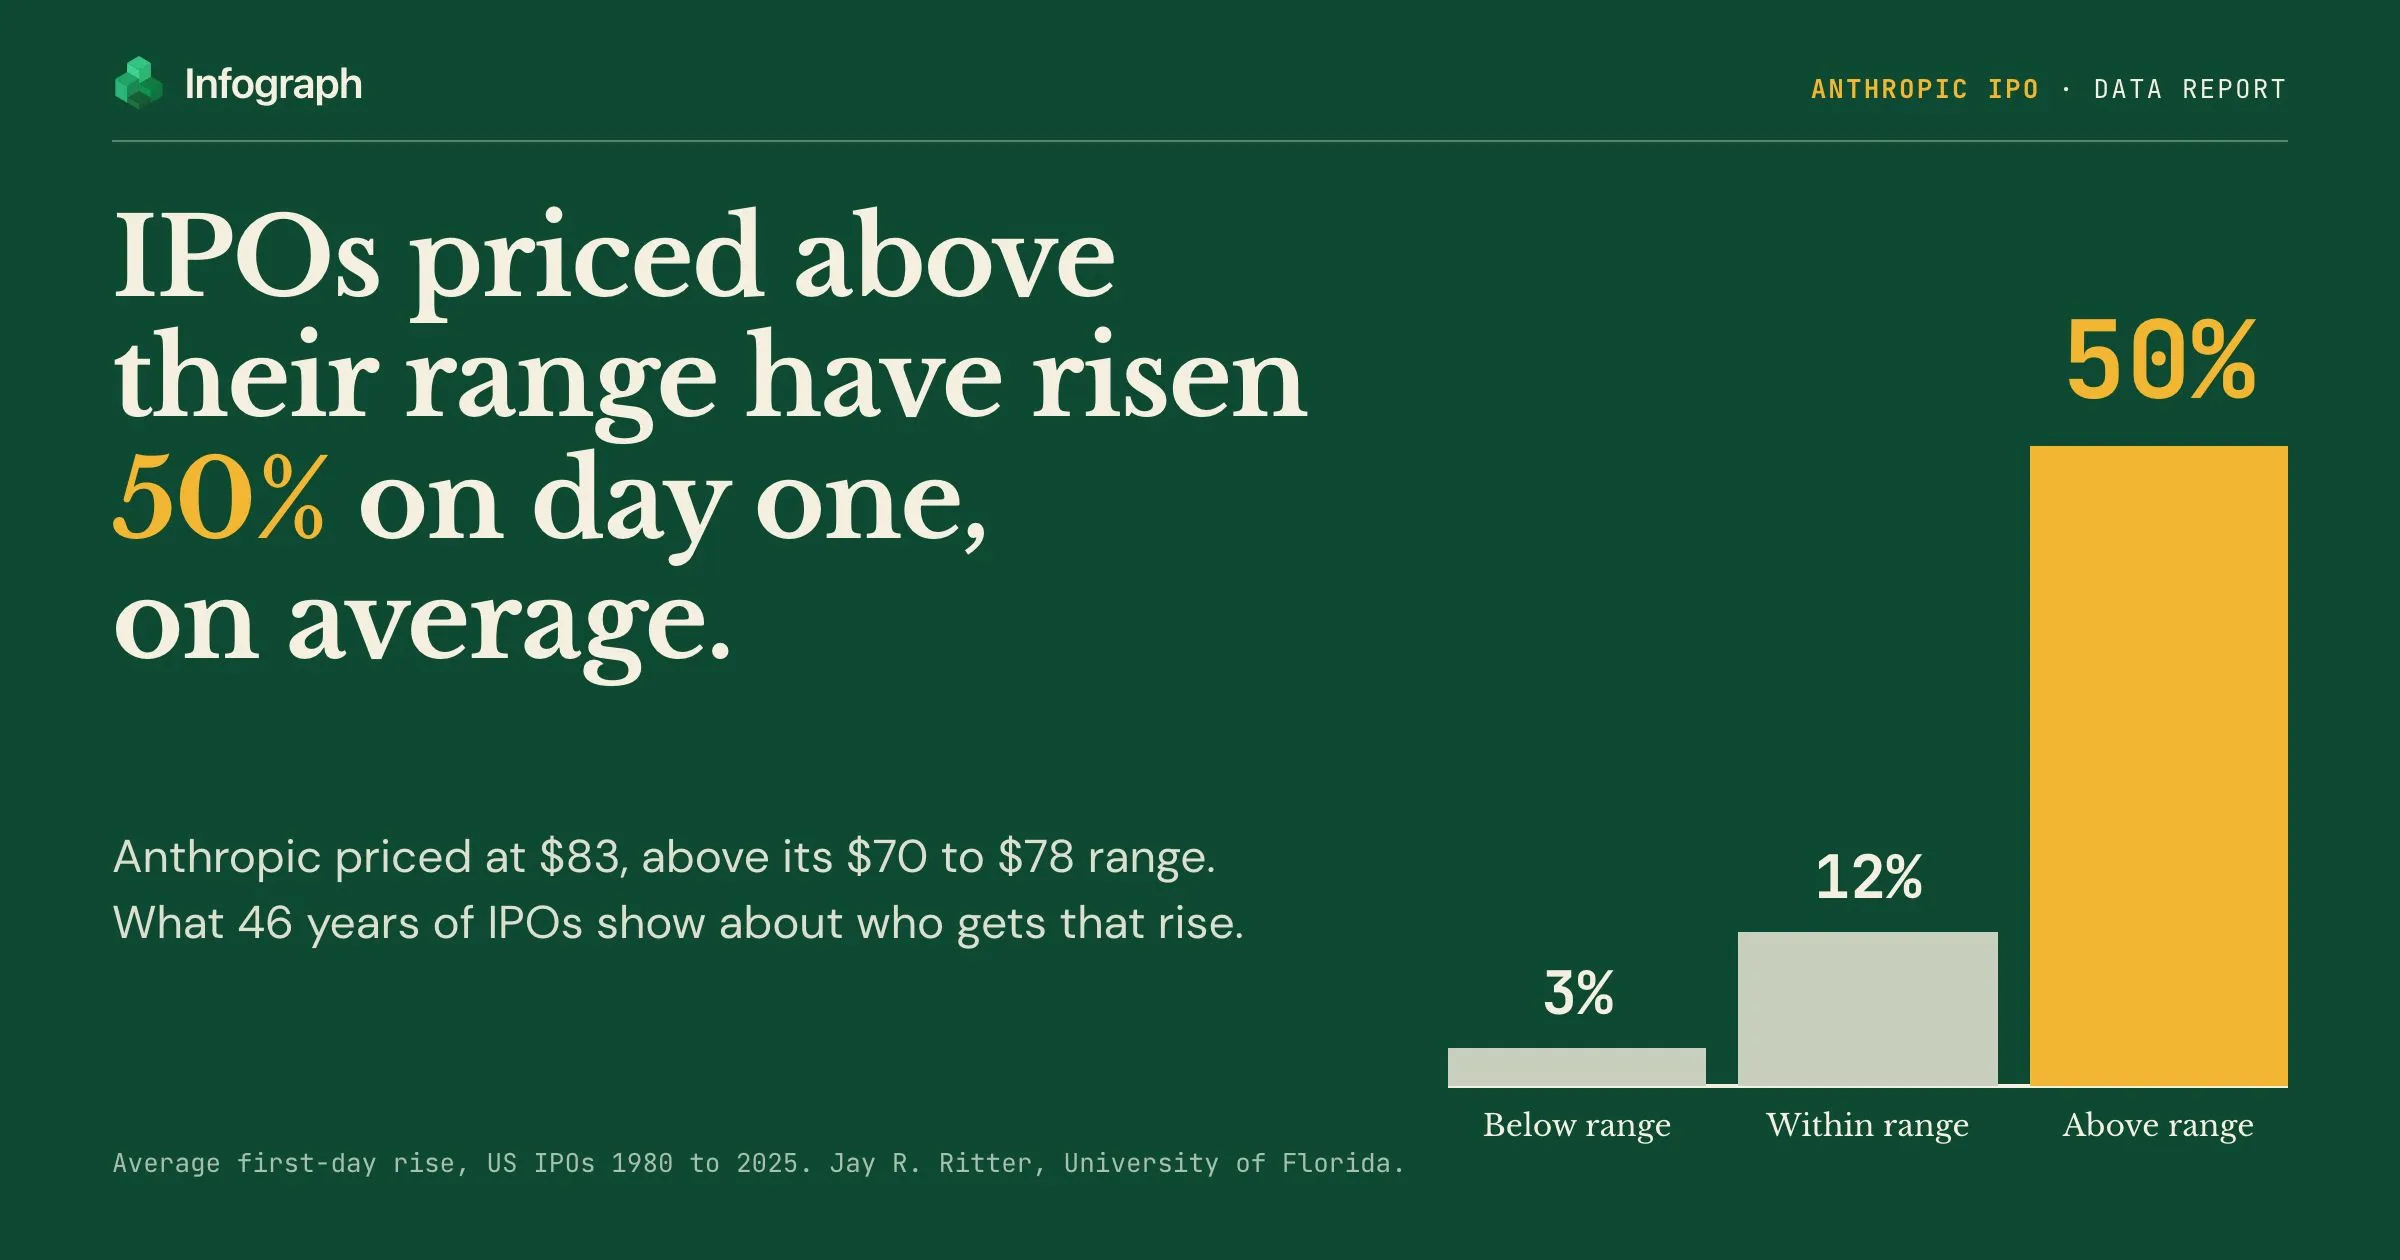
- IPOs priced above their range have risen 50% on day one, on average. Those priced inside the range rose 12%. Anthropic priced at $83, above its $70 to $78 range.
- That rise is money the sellers did not collect. SpaceX’s first day handed its first buyers $14.4 billion, the most of any IPO in the US. Anthropic sold 980 million shares, so every $1 of first-day rise is $980 million.
- Big companies rise less. Companies with $500 million or more in sales have risen 13.3% on average since 2001. SpaceX rose 19%.
- Most IPOs bought on day one went on to lose money. Of every 100 IPOs bought at the first day’s close, 60 had lost money three years later. For bigger companies it was about half.
Made with Infograph
Crunched the data
Jay Ritter's record of US IPOs since 1975, his 445 largest first-day windfalls and 8,153 daily share prices, from 5 sources
Found the pattern
IPOs priced above their range rose 50% on day one on average; across all IPOs, 60 in 100 bought at the first day's close had lost money three years later
Built the report
Connect your apps and databases. Infograph scans gigabytes of data, not just what fits in a chat window, and hands back results.
No credit card required
Anthropic priced its IPO on Wednesday night at $83 a share. The range it had filed was $70 to $78. It also sold more shares than planned, 980 million of them, which raised $81.3 billion. No IPO before it had raised that much at this stage. SpaceX raised $75 billion in June, and $85.7 billion once its bankers took the extra shares they had an option on.
The price is the number everyone is quoting. Read alone, it hides the more useful one. An IPO has two prices, a day apart. The offer price is what the investors who were given shares pay. The first-day close is what the market says the shares are worth a day later. The gap between them is called the pop.
So what usually happens when an IPO is priced above its range, and who gets the pop? Jay Ritter, a finance professor at the University of Florida, has tracked every US IPO since 1975. We went through his record.
An IPO priced above its range has risen 50% on its first day, on average. The rise goes to the people who got shares at the offer price. And across all IPOs, most of those bought at the end of the first day had lost money three years later.
- Average first-day rise of US IPOs priced above their filed range, 1980 to 2025. Within the range: 12%. Below it: 3%
- 50%
- Source: Jay R. Ritter, price revision statistics, Table 7
- Made by SpaceX's first buyers on its first day in June 2026, and not collected by the sellers. The most in the US before it was Alibaba's $8.3 billion in 2014
- $14.4bn
- Source: Ritter, Money Left on the Table in IPOs by Firm, 12 November 2026
- What every $1 of first-day rise comes to on Anthropic's 980,000,000 shares
- $980m
- Source: Anthropic's pricing announcement, 18 November 2026
- IPOs of all sizes that had lost money three years after their first-day close. 5,516 of 9,195 IPOs from 1975 to 2021
- 60 in 100
- Source: Ritter, long-run returns on IPOs, Table 16e
What we analysed in the IPO record
The record is the work of one person. Ritter publishes his tables free. We read them into one database, added Anthropic’s own terms and a year of daily prices, and crunched them in Infograph:
Jay R. Ritter's IPO data. University of Florida, IPOs from January 1975 to December 2025; the by-firm list is dated 12 November 2026. His tables on first-day rises, pricing against the range, money left on the table and returns over the next three years, and his list of the 445 largest first-day windfalls. The tables cover between 2,734 and 9,345 IPOs each. Each was checked against the totals printed in the source. Open the original.
- IPOs on his list
- 16,030
- IPOs in the first-day tables
- 9,345
- largest first-day windfalls
- 445
Anthropic's pricing announcement. Anthropic, with its Form S-1 on SEC EDGAR, Announcement of 18 November 2026; Amendment No. 3 filed 17 November 2026. The final price and share count, who is selling the shares, and the range and share count the company had filed. Open the original.
- shares
- 980,000,000
- a share
- $83.00
Nasdaq daily closing prices. Nasdaq, To 17 November 2026. The first year of trading for the largest first-day windfalls since November 2016. A stock is included only where its first-day close matches Ritter's figure. Open the original.
- daily prices
- 8,153
- stocks
- 35
Analysed in Infograph. One database: the first-day rise by how the deal was priced, the dollars each big first day left behind, and what the shares did next. Open the interactive report.
What is Anthropic’s IPO price?
$83 a share. That is the offer price: what the investors who were given shares in the IPO pay, mostly large funds. Everyone else buys on the Nasdaq exchange once trading starts, at whatever the price is by then.
Anthropic had planned to sell 825 million shares at $70 to $78. It sold 980 million at $83. Anthropic itself is selling 956 million of them, and existing shareholders are selling the rest.
If the shares end their first day above $83, the gap is profit for the people who got in at $83. It is also money the sellers could have raised and did not. On 980 million shares, every $1 of gap is $980 million.
A rise of 17.7% would leave as much on the table as SpaceX did.
What is an IPO pop, and when is it biggest?
A pop is the rise from the offer price to the price at the end of the first day. Most IPOs have one. Across 9,345 US IPOs since 1980 the average is 19%. A few huge first days pull that up. The typical IPO, the one in the middle, rose 7%.
How big it is depends on how the deal was priced. Before an IPO, a company files a price range. Then its bankers take orders. If orders are weak, the final price lands below the range. If they are strong, it lands above.
You might expect a higher price to leave less room for a jump. The record shows the opposite.
When orders flood in, the bankers raise the price, but only part of the way. The rest shows up on day one. The 50% is an average over 46 years, and the dot-com years pull it up. From 2001 to 2019 it was 38%. From 2020 to 2025 it was 51%.
Size cuts the other way. Companies with at least $500 million in sales have risen 13.3% on average since 2001. SpaceX rose 19%.
How much money did SpaceX leave on the table?
$14.4 billion. Even a modest jump is a huge sum when the deal is huge.
SpaceX sold 556 million shares at $135 in June. They closed the first day at $160.95. The gap was $25.95 a share. Ritter has a name for the gap times the shares: money left on the table. It is what the first buyers made in a day and the sellers did not collect.
The most any IPO in the US had left before SpaceX was Alibaba’s $8.3 billion in 2014. Ritter keeps Alibaba off his list of US companies, because it sold receipts for foreign shares. On that list the next largest is Visa’s $5.1 billion in 2008.
One company’s first day left more than every IPO Ritter counts in 2025 put together. In 46 years, only four whole years beat it: 1999, 2000, 2020 and 2021.
Do IPOs usually go up after the first day?
Ritter measured the same 9,253 IPOs twice. Once as if you bought at the offer price. Once as if you bought at the end of the first day, a price anyone could have paid.
The offer-price buyers kept the pop. The day-one buyers paid for it. Over three years the first group came close to matching the stock market. The second group fell 20.5 points behind it.
Those are averages again. A few IPOs become giants and pull the average up. Most do not.
5,516 of 9,195 lost money from the first day’s close. 3,537 lost more than half. Only 162 gained more than 500%, and those few are why the average is still positive.
Getting in at the offer price made the losses smaller, not rare. 56 in 100 still lost money.
Bigger companies did better. Of the 4,112 IPOs with at least $100 million in sales, 49 in 100 lost money from the first day’s close, and the typical one ended slightly up.
What happened to the biggest first days of the last ten years?
Those tables are averages over decades. So we also followed the stocks themselves: the largest first-day windfalls since 2016, day by day, for a year.
29 of them have traded for a full year. 23 ended that year below their first-day close. Measured from the offer price, 18 of the same 29 were ahead.
The pop is not the only reason. Many of these companies listed in 2020 and 2021, and their first year ran into the 2022 sell-off. Across the whole record the shortfall is smaller. In its first year after the first close, the average IPO gained 5.6%. Companies of the same size gained 11.4%.
SpaceX is 110 trading days in. It closed its first day at $160.95, reached $201.80 two days later, and fell to $108.27 by early August. On 17 November it closed at $141.70. That is below its first-day close and above its $135 offer price.
Is a first-day jump bad for the company?
No. A jump is not a sign of a bad stock. Since 2001, IPOs that rose on day one went on to do better than IPOs that fell. Over three years the risers ended 8.5 points behind the market. The fallers ended 32 points behind.
Tech has done better than the rest. Tech IPOs bought at the offer price beat the market by 15.6 points over three years. Bought at the first day’s close, they still fell 12.7 points behind.
And the people who run the company rarely mind. Anthropic is selling a small slice of itself, and its founders, staff and backers keep the rest. A jump makes every share they still hold worth more on paper. Ritter and Tim Loughran wrote a paper on exactly this, called “Why Don’t Issuers Get Upset About Leaving Money on the Table in IPOs?”
So who gets the jump?
The buyers at the offer price, the night before. That part is true by definition. What the record adds is what came next. Shares bought at the first day’s close cost more, because the pop was already in the price. The same IPOs returned 36.3% from the offer price and 19.1% from the first close.
None of that sits in one table. The first-day rises are in one file, the dollars left behind in another, the three years after in a third, and Anthropic’s own terms in a filing and an announcement. It took all of them in one place, side by side, to see who the pop has paid.
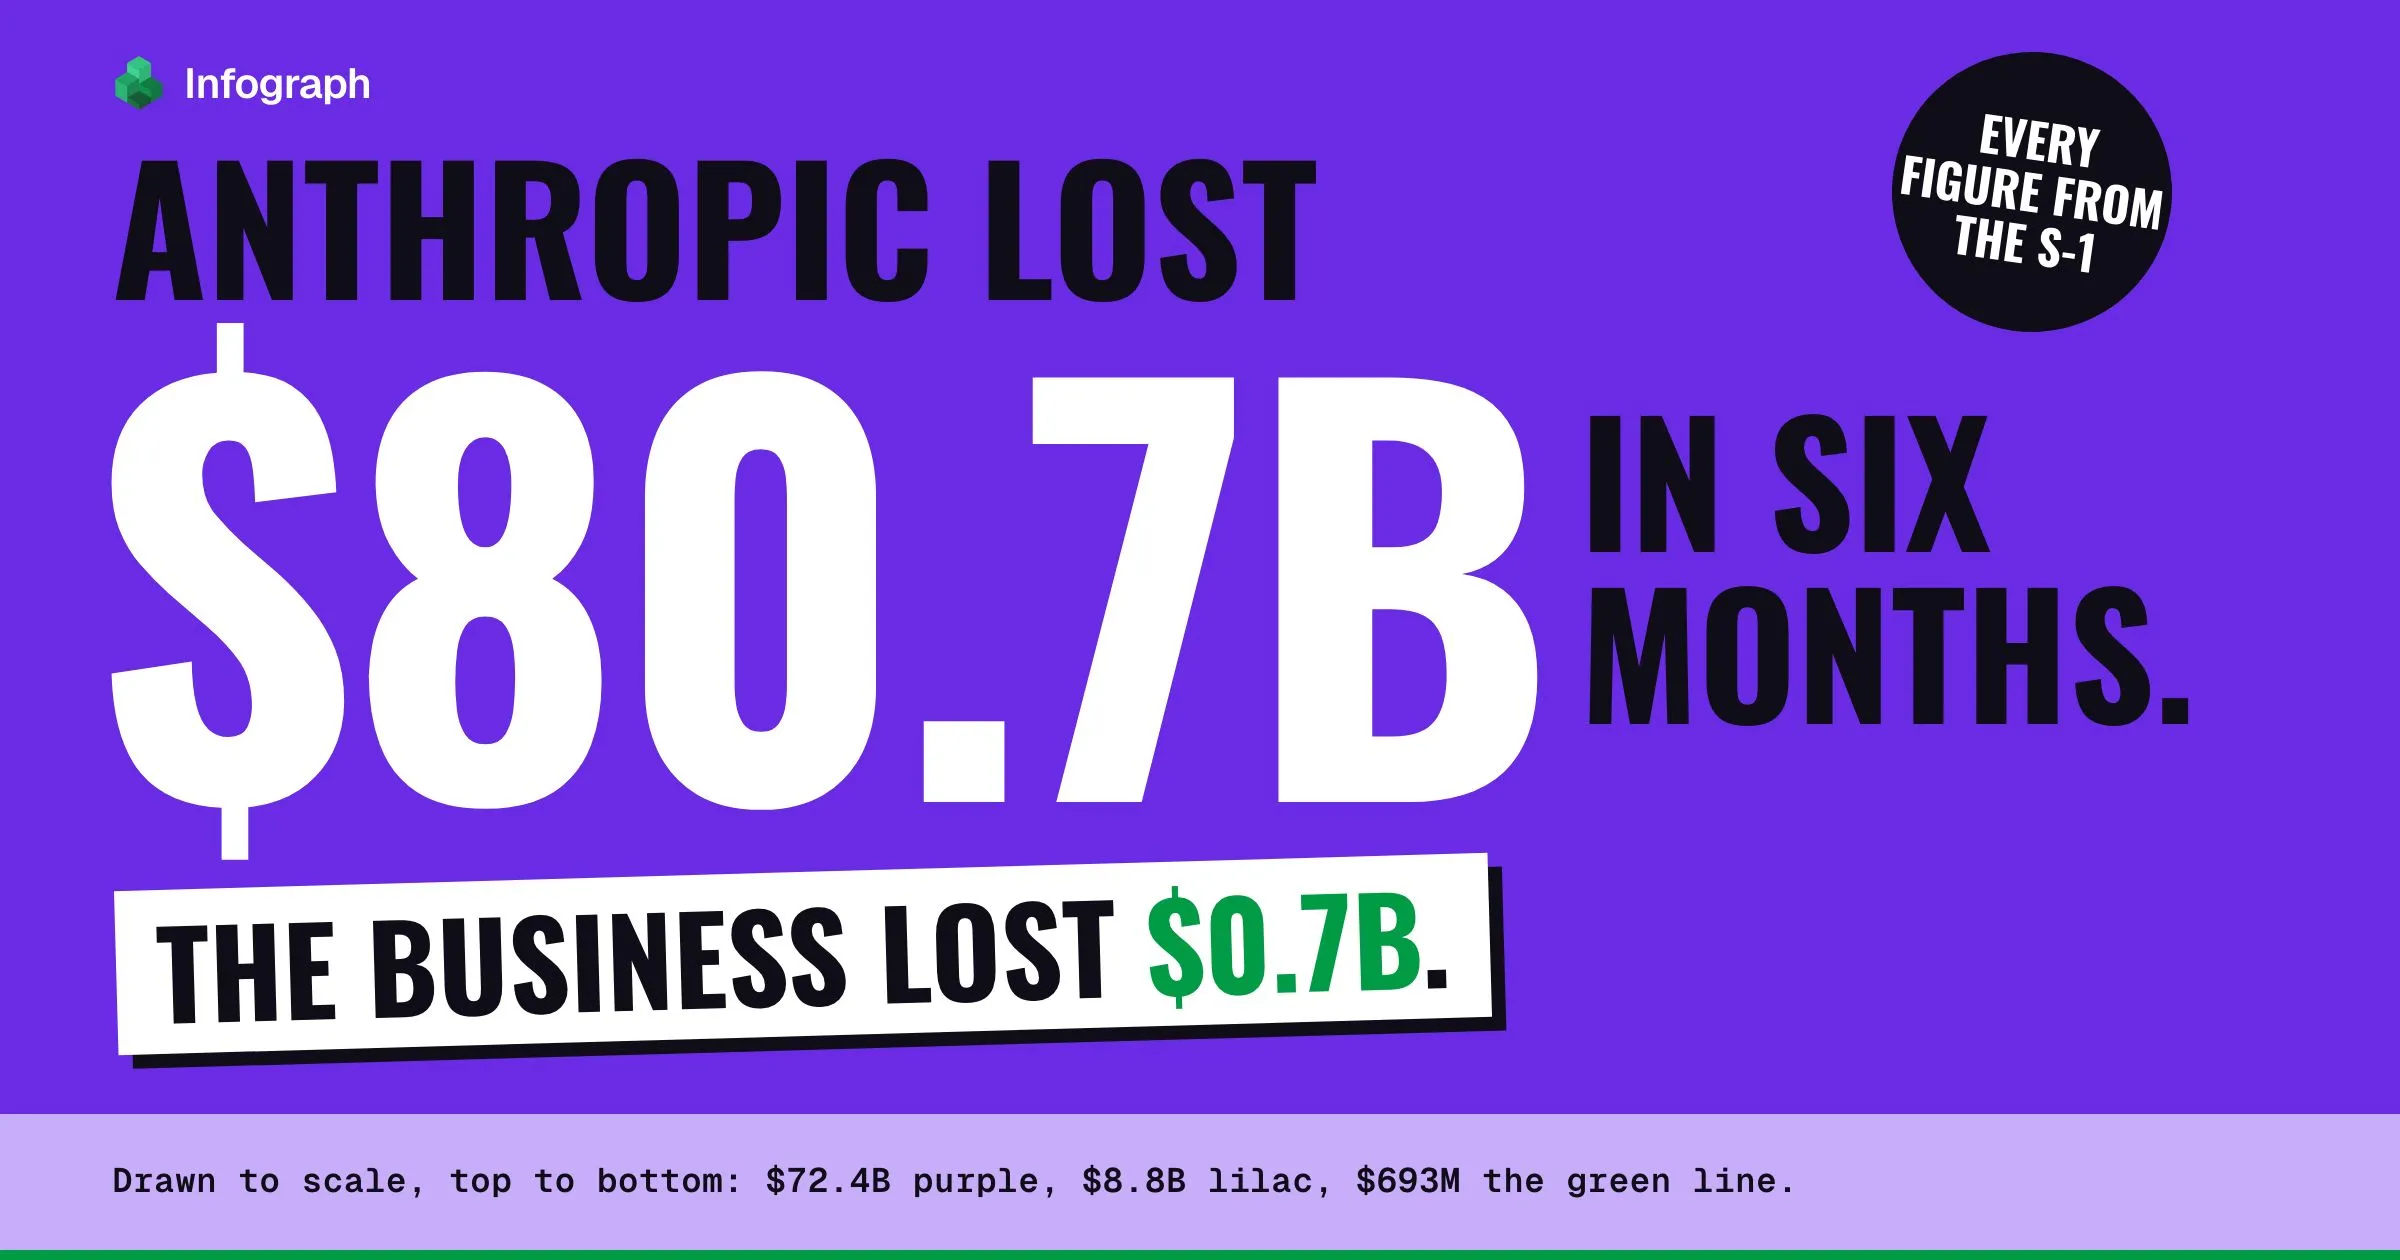
For the company behind the price, see what Anthropic’s filing shows behind its $80 billion loss.
Analyze your data with frontier AI, at scale
Upload your data, connect your apps and databases in seconds. Infograph enables frontier models to scan gigabytes of data, not just what fits in a chat window, and hands back results, data reports and live dashboards.