Loved by Marketing Built with Infograph
Meta Ads Dashboard: Find Tired Ads Before They Burn Your Budget
A Meta Ads dashboard that grades every ad against its own first week, shows spend drifting into tired ads, and turns last Black Friday into a budget.
Key takeaways
- See which ads are wearing out, graded against their own first week. In this sample, three tired ads took $4,592, or 39% of the last 14 days’ spend.
- Know what Black Friday will cost in your own account. Last year’s prices say the four days from Black Friday to Cyber Monday will cost about $7,286, for the same impressions that cost $6,355 last time.
- Put fresh creative where it’s cheapest. On Instagram, Reels cost $28.90 a purchase against $43.91 for Feed, about a third less.
Made with Infograph
Connected the data
Built the dashboard
Graded every Meta ad against its own first week and turned last Black Friday's costs into this year's budget, in one live dashboard for you to monitor
Shared with your team
Send a link, or work on it together in your account
Connect your apps and databases. Infograph builds live, interactive dashboards for you and your team.
No credit card required
A Meta Ads dashboard is one page that shows how your Facebook and Instagram ads are doing over time: what you spent, what it bought, and which ads still earn their place. This one answers the two questions you have 11 days before Black Friday. Which of my ads are tired? And what will the most expensive week of the year cost me?
An ad is tired when the people who see it have stopped clicking. Its click-through falls well below where it started, usually because the same people have seen it too often. A tired ad rarely looks broken. It still spends, and it still gets some sales. Ads Manager shows you its numbers for any date range. It doesn’t show how far the ad has fallen from its own first week, or how much of your budget now sits in ads like it.
This dashboard puts that on one page, next to what last Black Friday cost you. We walk through it with Fernhill Candle Co., a sample candle brand whose ad account is shaped exactly like the data Infograph syncs from Meta. Connect your own account, and every panel reads your ads instead.
If you want last Black Friday in your own data, connect this week. Infograph’s first sync of Meta reaches back one year. Connect on 16 November and your data starts on 16 November 2025, 12 days before last Black Friday. Connect on 20 November and it starts only 8 days before.
- Of the last 14 days' spend went to three tired ads, $4,592 in all
- 39%
- Source: This dashboard, last 14 days
- Click-through of the one big ad still holding up, 62 days in, against its first week
- +6%
- Source: This dashboard, last 14 days
- More than last year to buy the same Black Friday to Cyber Monday impressions, if prices rise as they did then
- $931
- Source: This dashboard, Black Friday outlook
What the Meta Ads dashboard connects
Everything on the page comes from one connection, and nothing is typed in or exported:
Facebook Marketing. Daily results for every ad, with spend, impressions, link clicks, frequency and the purchases Meta reports, and the same results split by placement. The first sync loads a year of history, so last Black Friday is already in it. How to connect Facebook Marketing.
One Infograph dashboard, each source kept fresh on its own, with nothing exported or copied.
How to read your Meta Ads dashboard
Find your tired ads on the fatigue map
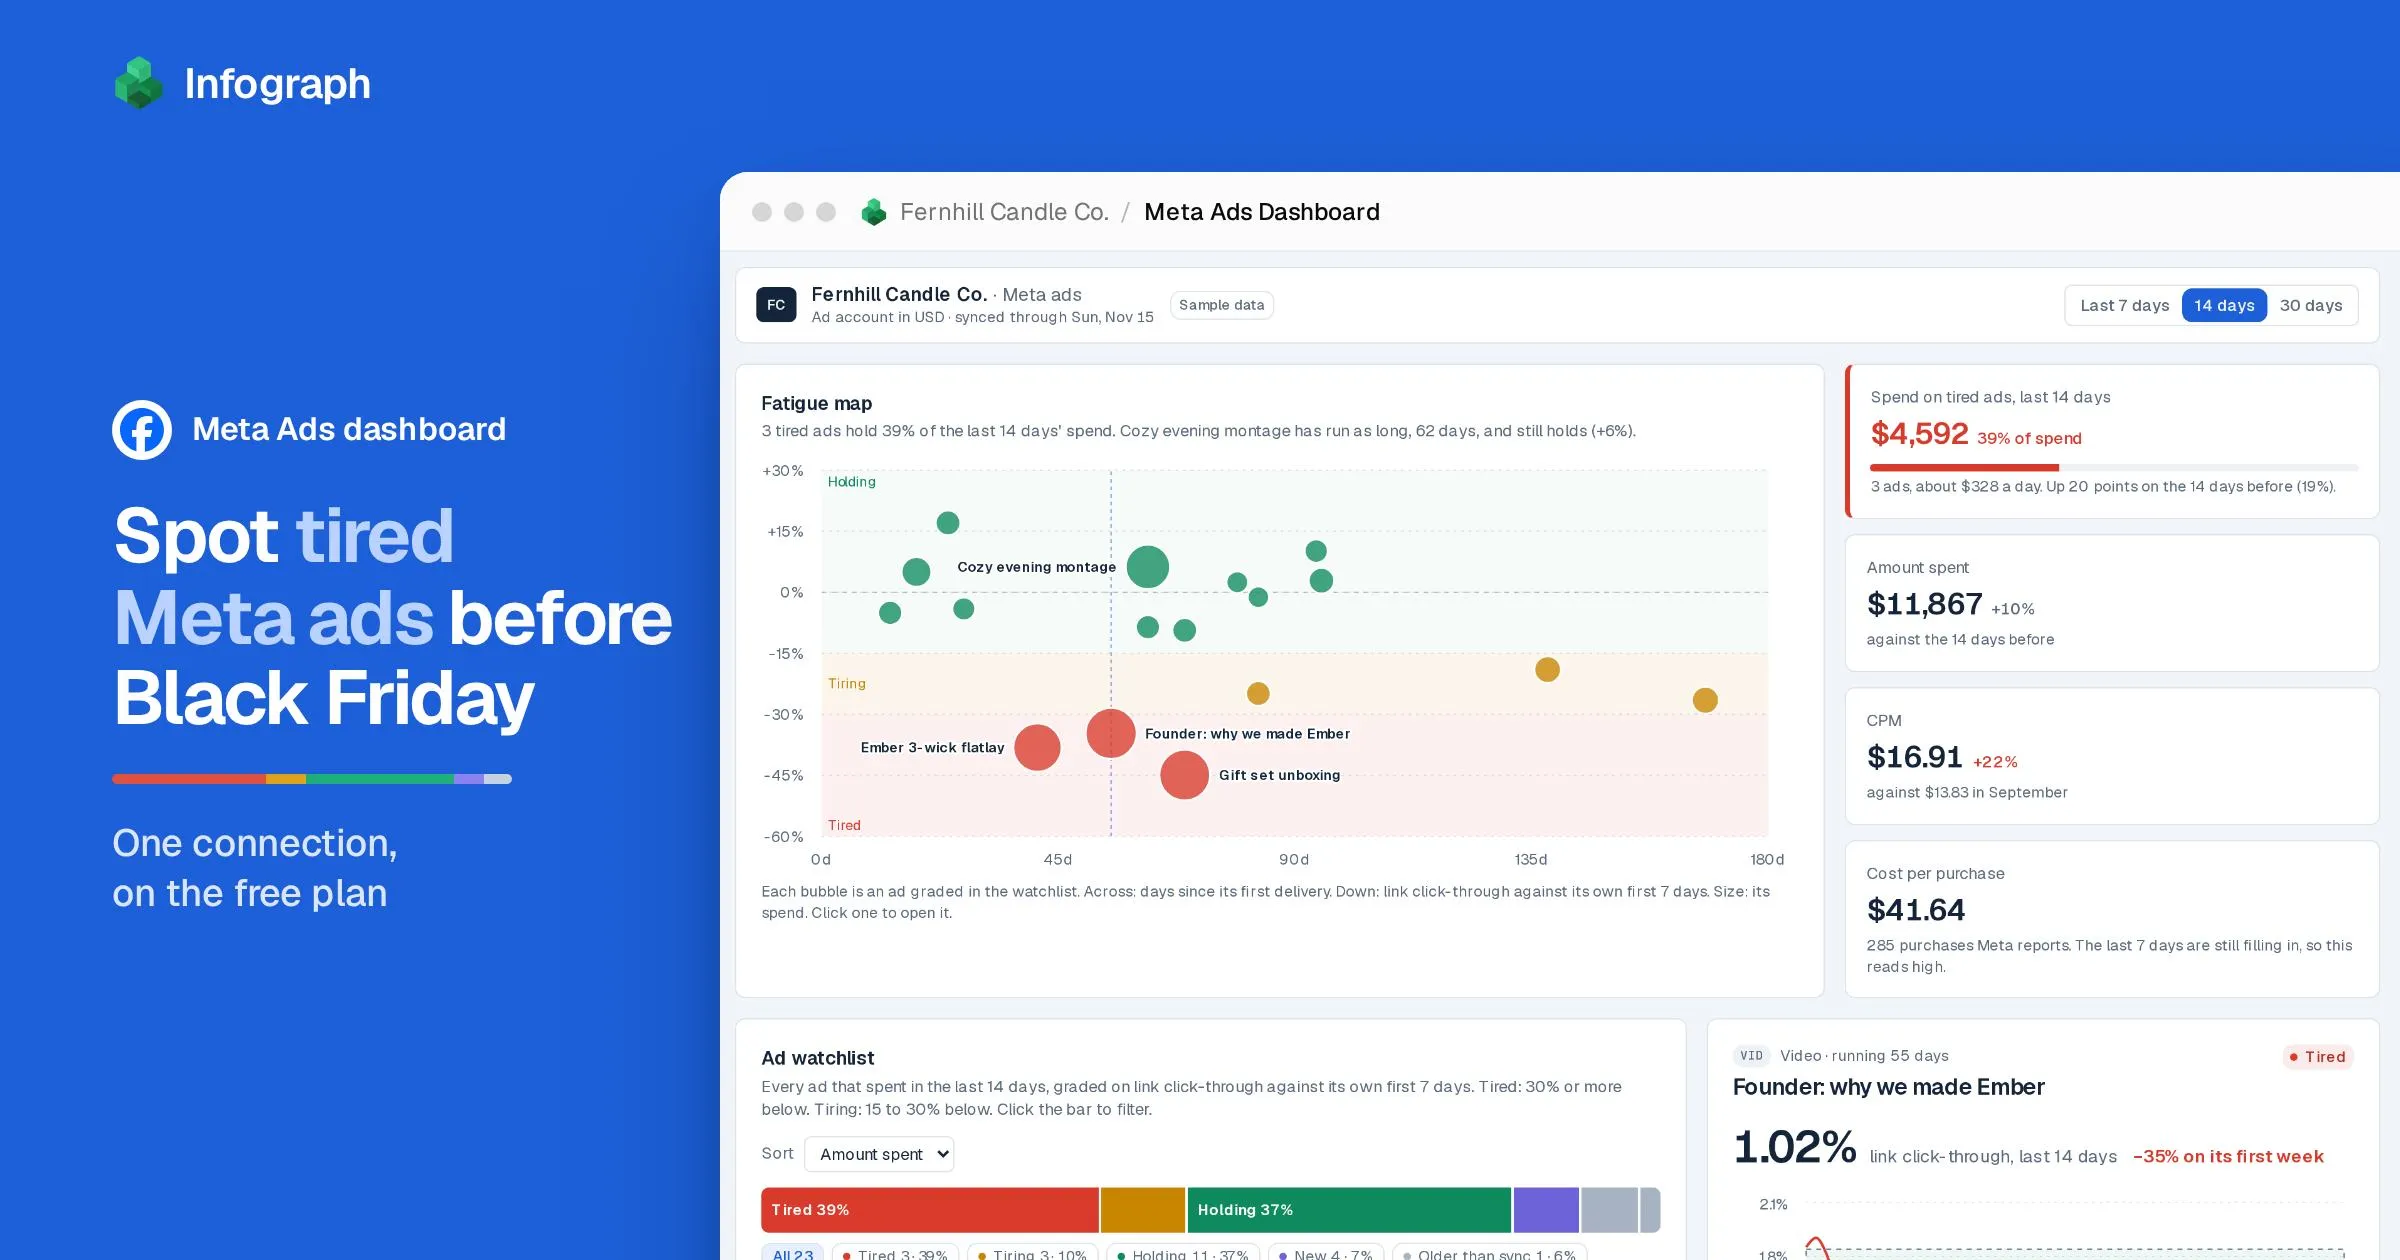
Start at the top. Each bubble on the map is one ad. The longer it has run, the further right it sits. The further its link click-through has fallen from its own first week, the lower it sits. Bigger bubbles spent more.
The bands give each ad a grade. Down 30% or more is tired, in red. Down 15 to 30% is tiring, in amber. Anything above that is holding, in green.
In the sample, three big bubbles have sunk into the red. A founder video’s click-through is down 35% on its first week. A gift set unboxing video is down 45%, and a static photo of a three-wick candle is down 38%. These are three of the account’s four biggest spenders.
The fourth biggest, Cozy evening montage, has run 62 days. That’s about as long as the other three, which have run 41 to 69 days. Its click-through is up 6%. So time alone can’t explain the tired ones.
What does set them apart is frequency: how many times each person sees the ad in a day. Meta counts it one day at a time, so it runs lower than the weekly frequency you may know from Ads Manager. Each person who sees one of the tired ads now sees it 1.30 to 1.41 times a day. For the montage, it’s 1.04.
Try the same test on your own account. Find an ad that has run as long as your tired ones and is still holding, then compare their frequency. If people see the holding ad less often, your tired ads probably need fresh creative more than a rest. Switching off every older ad would also switch off the one that still works.
Check what tired ads cost you
The red tile beside the map puts a price on the problem: $4,592 on tired ads in the last 14 days. That’s about $328 a day, and 39% of all spend. In the 14 days before, tired ads took 19%.
The tiles under it fill in the rest. CPM, what you pay for 1,000 impressions, is $16.91, 22% above September’s $13.83. Cost per purchase reads $41.64, but give that one a few weeks. Meta can add purchases to a day for up to 28 days after it, so the most recent week usually looks worse than it will end up.
That’s why the grades use clicks. A click is counted when it happens, while purchases keep arriving for weeks. A grade made on clicks today won’t shift when the late purchases come in.
Work through the watchlist
The watchlist turns the map into a to-do list. Every ad that spent in the period gets a row: its click-through over the last 60 days as a small line, its share of spend, how many times a day each person saw it, and its change against its first week.
The coloured bar on top splits the period’s spend by grade. Two more grades appear here for ads the map leaves out: new, for ads running under 10 days, and older than sync, for ads that started before your data does. Click a part of the bar, and the list shows only those ads.
Click any row and its own chart opens beside the list. Take the founder video. Its click-through fell from 1.56% in its first week to 1.02% now. Each person saw it 1.14 times a day at first, and 1.38 times now.
It also costs more to show. CPM rose from $13.89 to $17.68. Cost per purchase shows $26.94 then and $56.98 now, though the last figure will come down a little as late purchases arrive.
Look at the gap in the line. The ad was paused for four days in October. It came back a little stronger, then faded again. In this sample, a rest bought a few better days and then the decline carried on.
Worth knowing
Frequency can't be added up across days
Meta reports frequency for each day. If someone sees your ad on Monday and again on Tuesday, they count once on each day. Add the days together and you count them twice. So this dashboard shows frequency a day, averaged over the period, and never a weekly total. If you build your own version, ask for it the same way.
Watch spend drift into tired ads
The watchlist shows where you are today. This chart shows how you got there. Each day, it sorts that day’s spend by how each ad was doing over its own last seven days.
Tired ads took 11% of daily spend on 16 October, and 37% by 15 November. That 37% sits close to the 39% in the tile. The tile grades each ad over the full 14 days, so the two differ a little.
The tired ads didn’t get bigger budgets in that month. Each one spent slightly less a day by November. They are the ads that had the most money all along, and they wore out while they had it.
On your own account, a red layer that keeps growing is the signal to act. It means the ads your budget leans on are the ones that have stopped working.
Plan your Black Friday budget from last year
Swapping tired ads fixes what you pay for. Black Friday, on 27 November this year, changes what everything costs. This panel lines up daily CPM by days to Black Friday, last year against this year.
The sample’s data runs to 15 November, so the dashboard counts 12 days to go. It reads in three steps.
First, last year. Your data starts 12 days before last Black Friday, and over its first three days CPM averaged about $15.50. On Black Friday it was $25.70, a rise of 66%.
Second, this year. The last three days averaged $17.73, already 15% above the same point last year. Apply last year’s rise to that, and Black Friday comes in around $29.46.
Third, the money. Last year, the four days from Black Friday to Cyber Monday bought 270,201 impressions for $6,355. The same impressions at this year’s forecast cost about $7,286. That’s $931 more, or about $1,821 a day. The box counts impressions rather than people reached, because reach can’t be added across days either.
The forecast is last year’s curve laid on this year’s prices. It won’t be exact, and it can’t see what other advertisers do this year. It also can’t compare with last September, because your first sync reaches back one year and September falls outside it.
For a wider view, Lebesgue looked at its biggest Meta spenders. The median brand’s CPM ran 59% above September across Black Friday week 2025, and 84% above on the day itself.
Put fresh creative where it’s cheapest
Once you know which ads to replace, the next question is where the new ones should run. This panel ranks placements by cost per purchase over the last 30 days.
On Instagram, the gap is wide. Reels cost $28.90 a purchase and Feed cost $43.91, so Reels was about a third cheaper. On Facebook, Feed cost $30.18, close to Reels. So if your new creative is going to Instagram, make the vertical version first.
These are purchases Meta credits to each placement, so the last week is still filling in here too. And Meta now asks some ad accounts to opt in to device breakdowns in Ads Manager. If yours hasn’t, this panel stays empty until you do. Everything else syncs as normal.
See how often retargeting reaches the same people
Retargeting reaches a much smaller pool of people, so it’s worth its own check. The last panel shows how many times a day each person sees your retargeting ads, next to ads shown to new audiences.
Over the last 30 days, the sample’s retargeting audience saw its ads 2.13 times a day. New audiences saw them 1.19 times a day. In the 30 days before, retargeting was at 1.82, and its click-through has since fallen from 1.44% to 1.28%. Most of that pool has seen the ads already. Black Friday visitors should refill it. Until then, more retargeting budget mostly buys more views from the same people.
Meta’s data has no field that says which ads are retargeting, so the dashboard reads it from your ad set and campaign names. If yours say “RT” or “Retargeting”, it finds them.
Turn it into Monday’s plan
For Fernhill, the page adds up to a short list. Replace the three tired ads inside their own ad sets, with vertical versions cut first for Instagram Reels. Then plan about $7,300 for the four days from Black Friday to Cyber Monday. Your own account will give you your own list.
Should you stay in Ads Manager?
For a lot of advertisers, yes. Ads Manager is free and already shows frequency, click-through and CPM for every ad over any date range. It can also show “Creative fatigue” in its Delivery column. By Jon Loomer’s reading, that appears when cost per result is at least twice as high as it has been in the past. If you run a handful of ads and check them every morning, you may not need more.
This dashboard is for when that stops being enough. It grades each ad on clicks against its own first week, so late purchases don’t move the reading, and it shows how much of your spend sits in tired ads. It also turns last Black Friday, in your own account, into a number you can put in a budget.
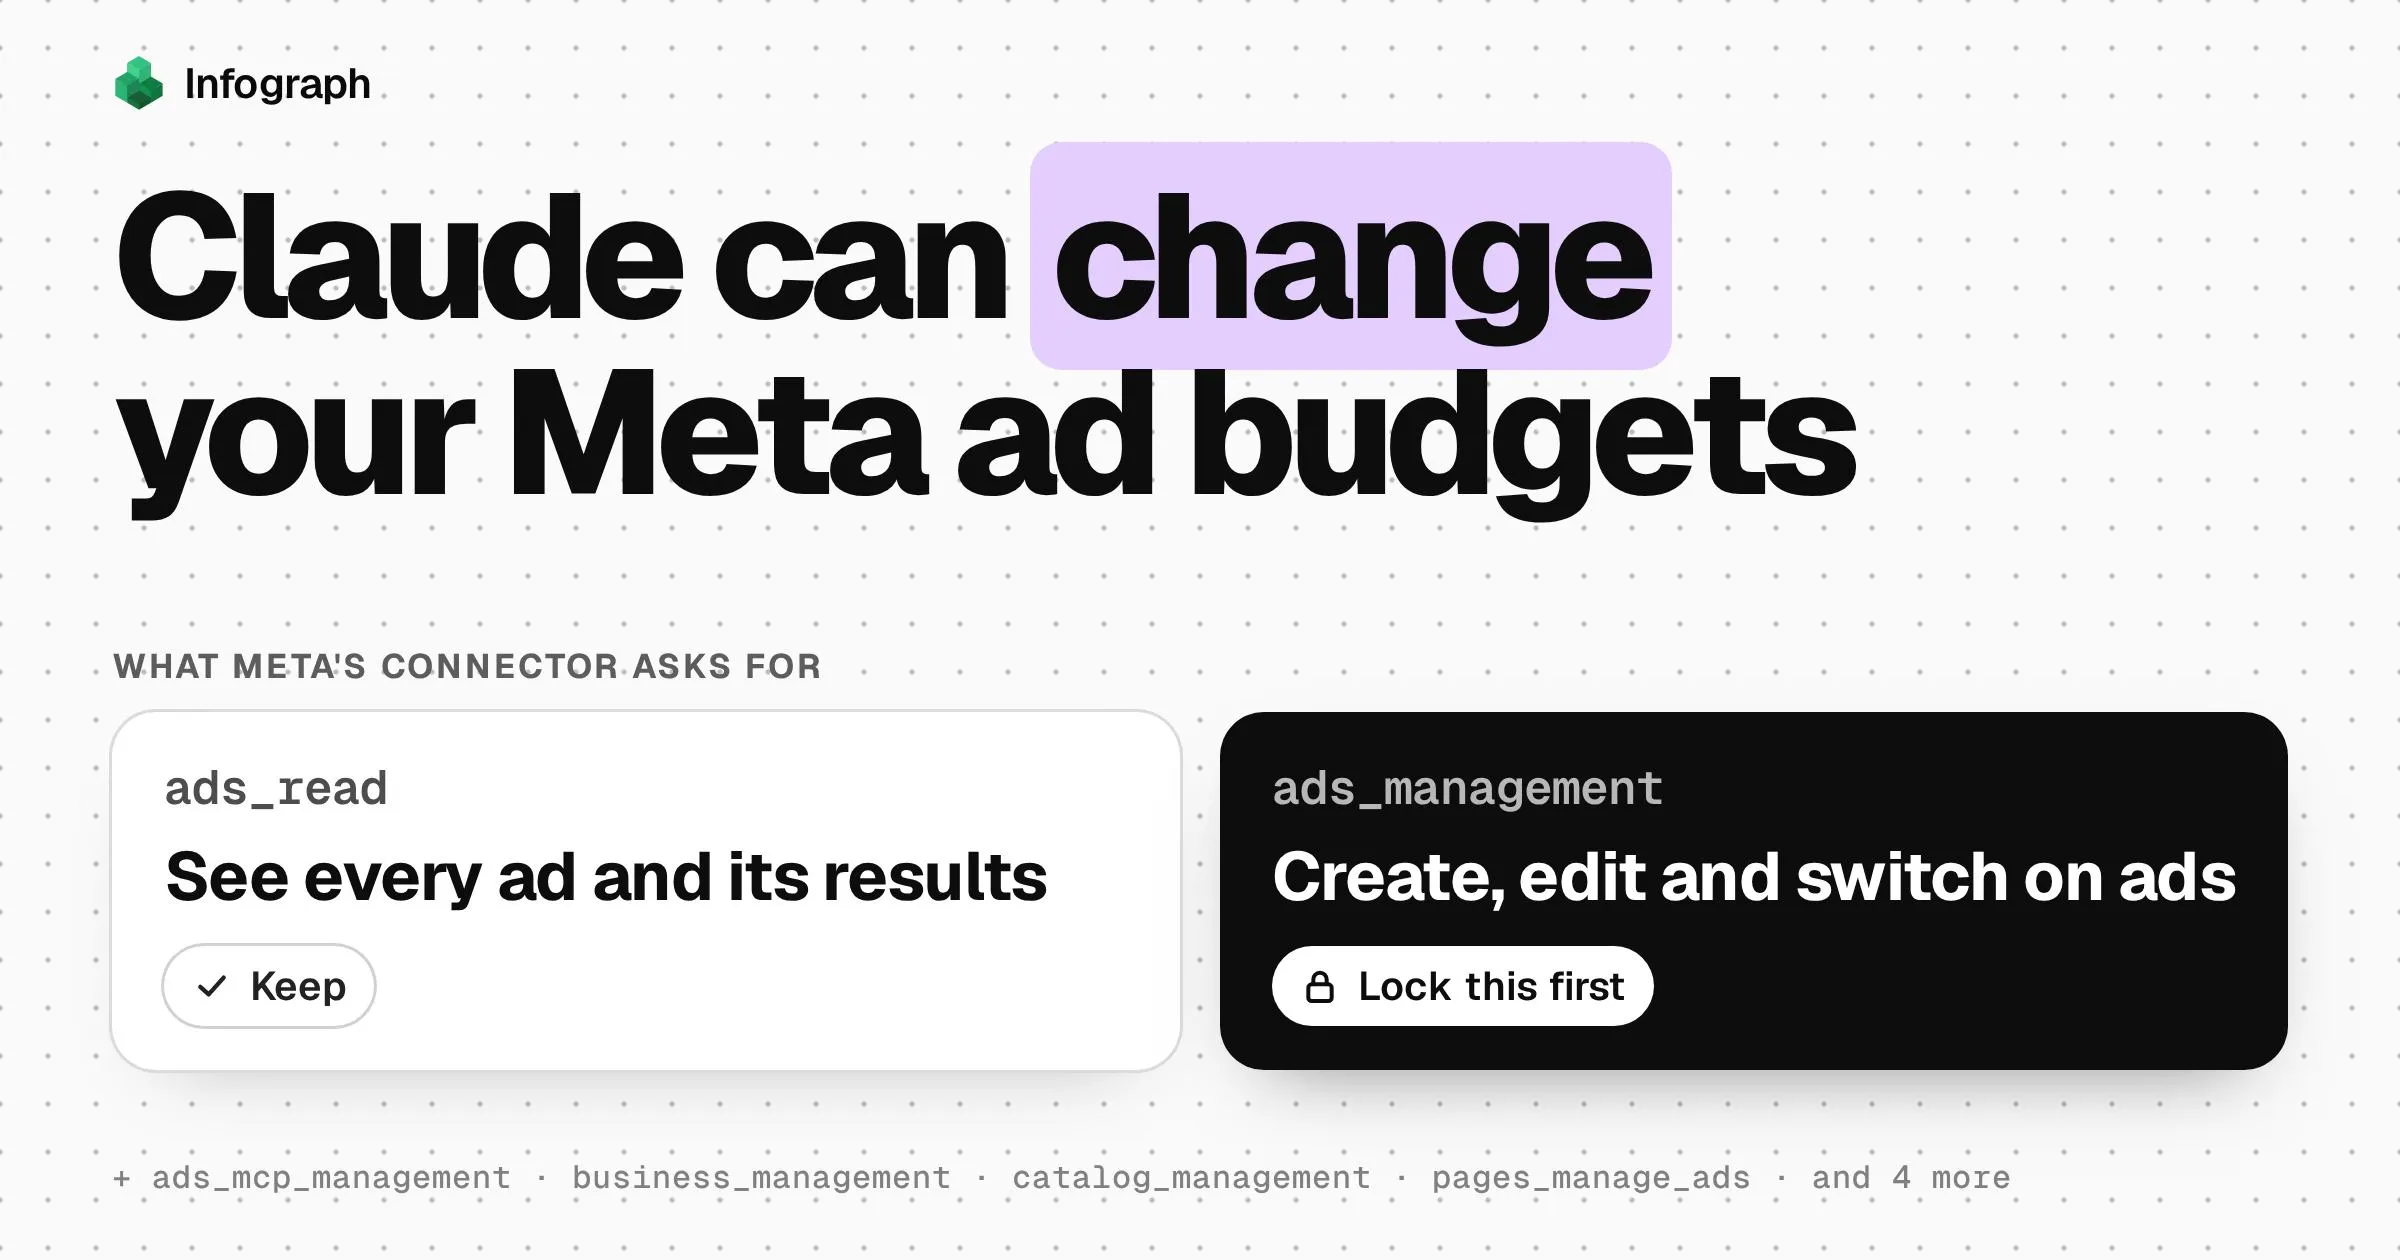
If you’d rather ask Claude, Meta’s own connector lets it read your ad account and change it too. Here’s how to keep it read-only.
Build a Meta Ads dashboard from your own account
Make a Meta app and a token
This takes about 15 minutes, once, by the connection guide’s estimate. You need admin rights on the Meta business portfolio that owns your ad accounts, or someone who has them.
In Meta for Developers, create a small app and connect it to your portfolio. Then add a system user, which is a login Meta makes for apps rather than people. Give it full access to the app, and View performance on each ad account.
Last, generate a token that never expires, with one permission: ads_read. That permission reads your ads and can’t create or change anything, so it can’t touch a budget. The connection guide shows every screen.
Connect Facebook Marketing
Paste the token into Infograph. Every ad account the system user can see is listed. Pick Ads insights (daily) and Ads insights by platform and device. The first sync loads a year of history. A big account loads in stages, oldest days first.
Ask Infograph for the dashboard
This dashboard needs one connection, so it fits the Free plan. On Free, press Sync before you look. Plus syncs every day, and Pro every 30 minutes. Tell Infograph what you want to know. Something like this:
Black Friday is coming. Using my Facebook Marketing data, show me which of my ads are wearing out. Grade each one on its link click-through over the last 14 days against its own first week, and show how much of my spend sits in the tired ones and how that share has moved. Then show how my CPM moved around last Black Friday, and the budget I’d need to buy last year’s Black Friday to Cyber Monday impressions again. Add which placements bring purchases cheapest, and treat the last 7 days of purchases as still filling in.
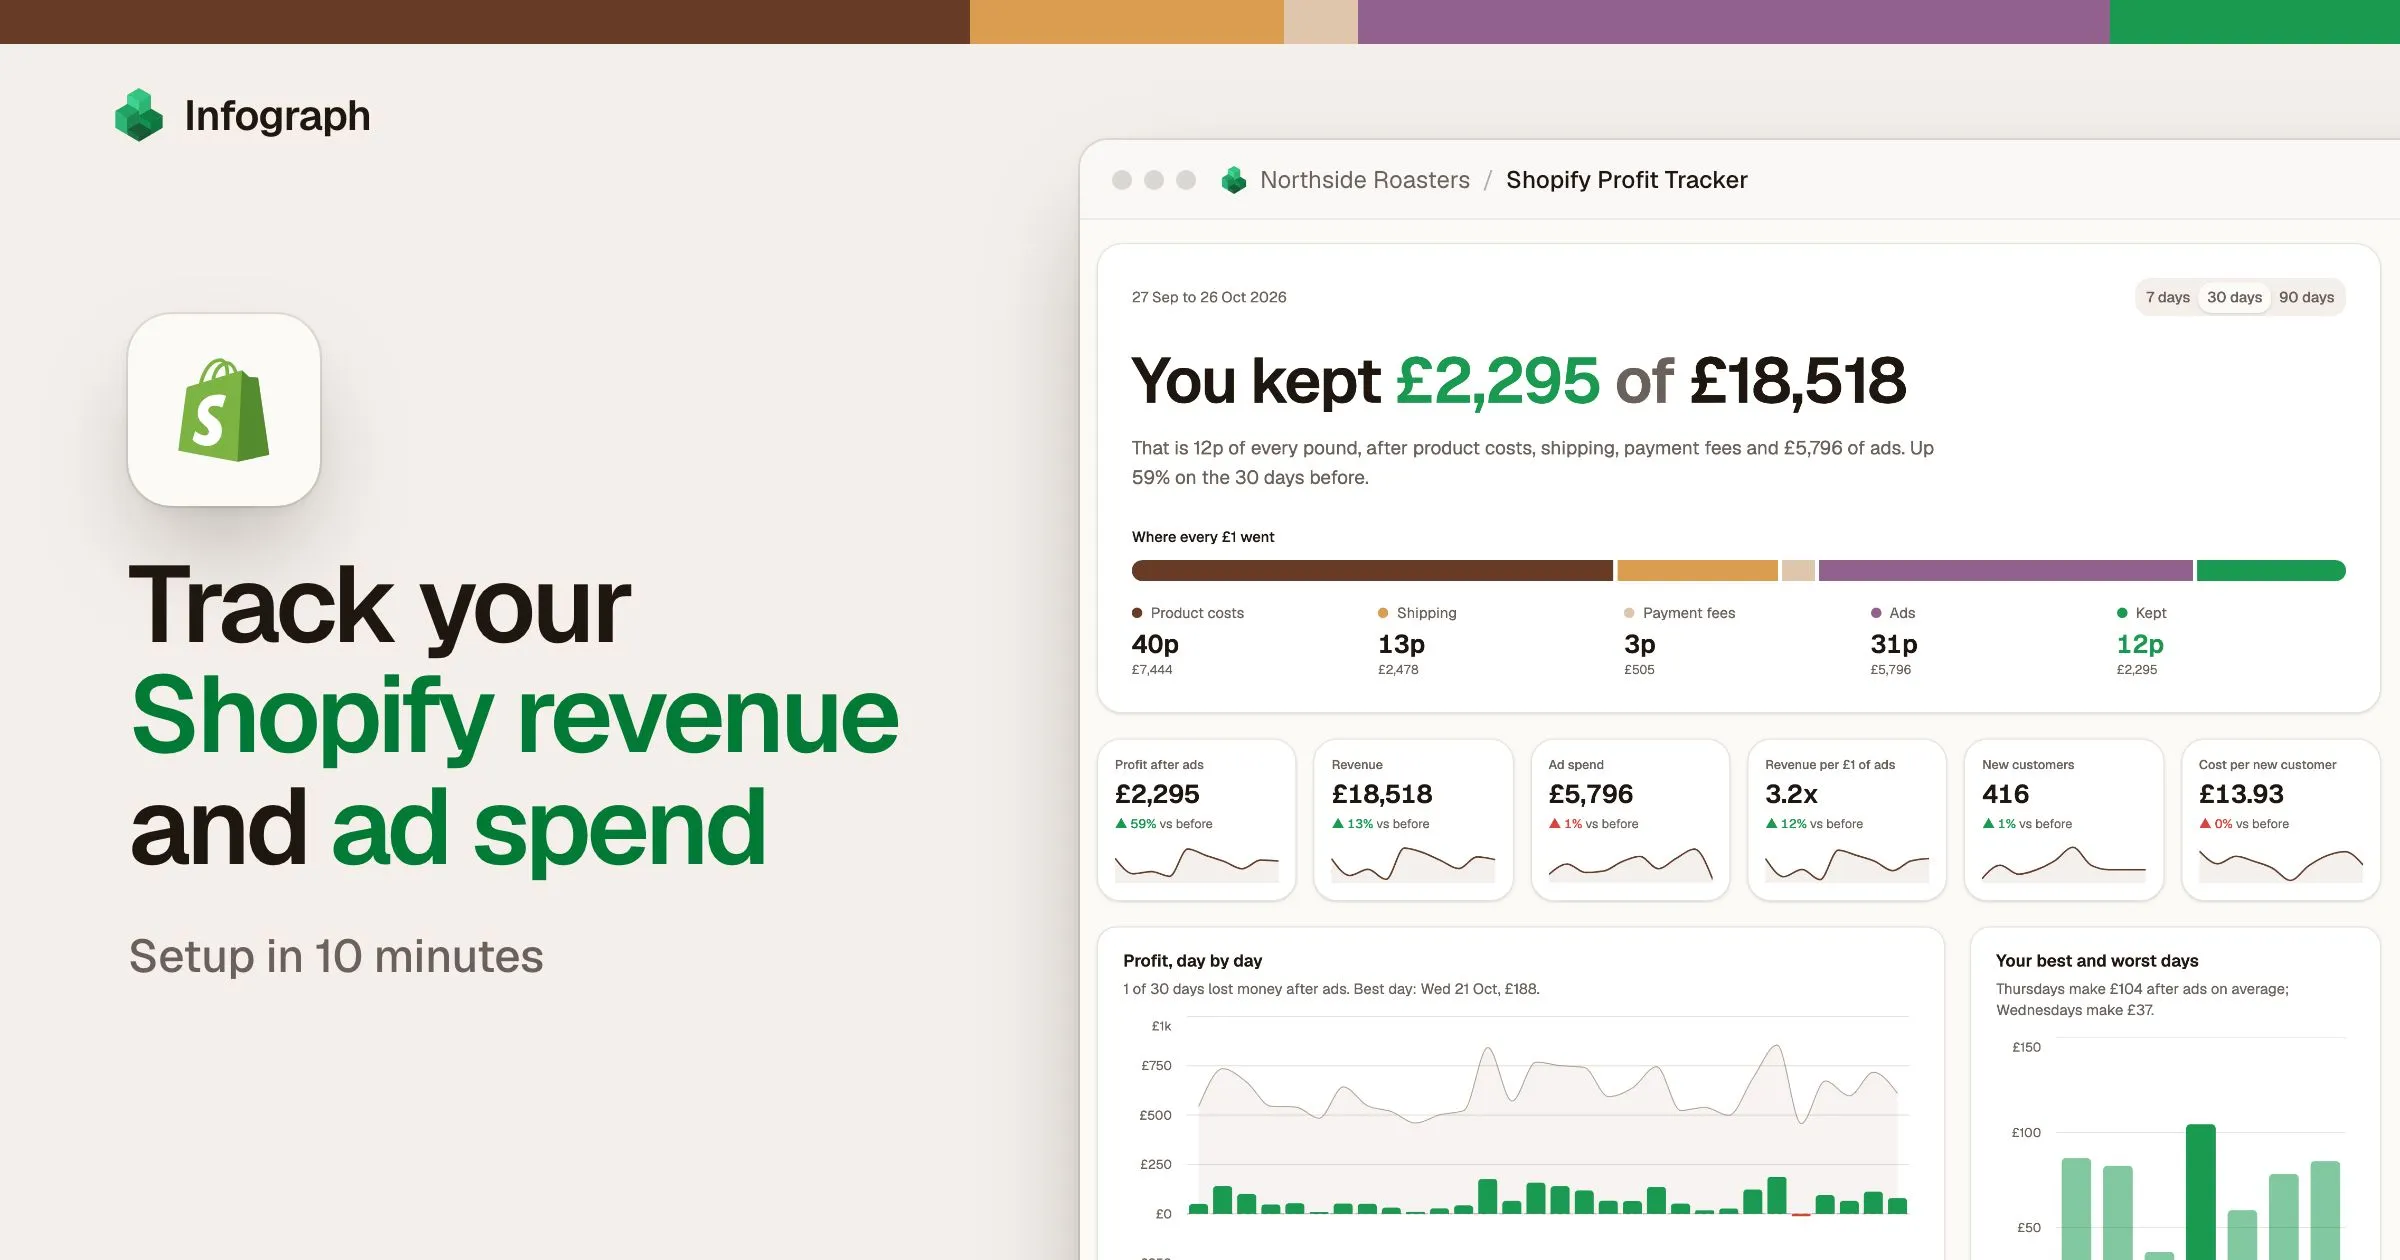
The Shopify option needs a second connection, so it takes Plus.
Meta Ads dashboard questions
What is creative fatigue in Meta ads?
It is when an ad's audience has seen it so often that fewer people click, so each result costs more. This dashboard calls an ad tired when its link click-through over the period is 30% or more below its own first 7 days, and tiring when it is 15 to 30% below.
Doesn't Ads Manager already flag tired ads?
It can show Creative fatigue in its Delivery column. By Jon Loomer's reading, that appears when cost per result is at least twice as high as it has been in the past. This dashboard grades on link clicks instead, which are counted when they happen, and adds each ad's share of spend and how that share has changed.
Why can't I see a 7-day or lifetime frequency for each ad?
Meta reports frequency for each day, and the same person seen on two days counts on both. Adding days together would count people twice, so the dashboard shows frequency a day, averaged over the period.
Why does my cost per purchase look high for the last week?
Meta can add purchases to a day for up to 28 days after it, and Infograph fetches the last 28 days again on every sync. Recent days fill in over time, so read the last week as provisional.
How much history will I see?
The first sync loads the last 365 days. Connect before Black Friday and last year's Black Friday is in it. Every later sync adds new days and keeps the old ones.
Which plan do I need?
Free works: this dashboard uses one connection, and Free allows one. On Free you press Sync before you look. Plus syncs every day, Pro and Teams every 30 minutes. Adding Shopify makes two connections, which needs Plus.
Can Infograph change my ads or budgets?
No. The token you give it has only the ads_read permission, which reads your ads and their results and cannot create or change anything.
Will the prompt build exactly this page?
No. It builds your own version from your account, and the layout may differ. This sample was built in Infograph with more care over the look than a first answer will have, and you can keep asking for changes until it suits you.
I'm having trouble connecting my Meta ad account
The guide covers each step and the errors you might see, such as a token without ads_read or an ad account the system user can't see:
Is Fernhill Candle Co. a real business?
No. It is a sample brand, with a year of ad data generated in exactly the shape Infograph syncs from Meta, so every panel on this dashboard can be built from a real ad account.