Loved by Marketing Built with Infograph
Shopify Profit Tracker: What You Really Keep After Ads, Costs and Fees
A Shopify profit tracker that takes product costs, shipping, fees and Meta and Google ad spend off your sales, and shows what you really keep each day.
Highlights
Know what you really keep
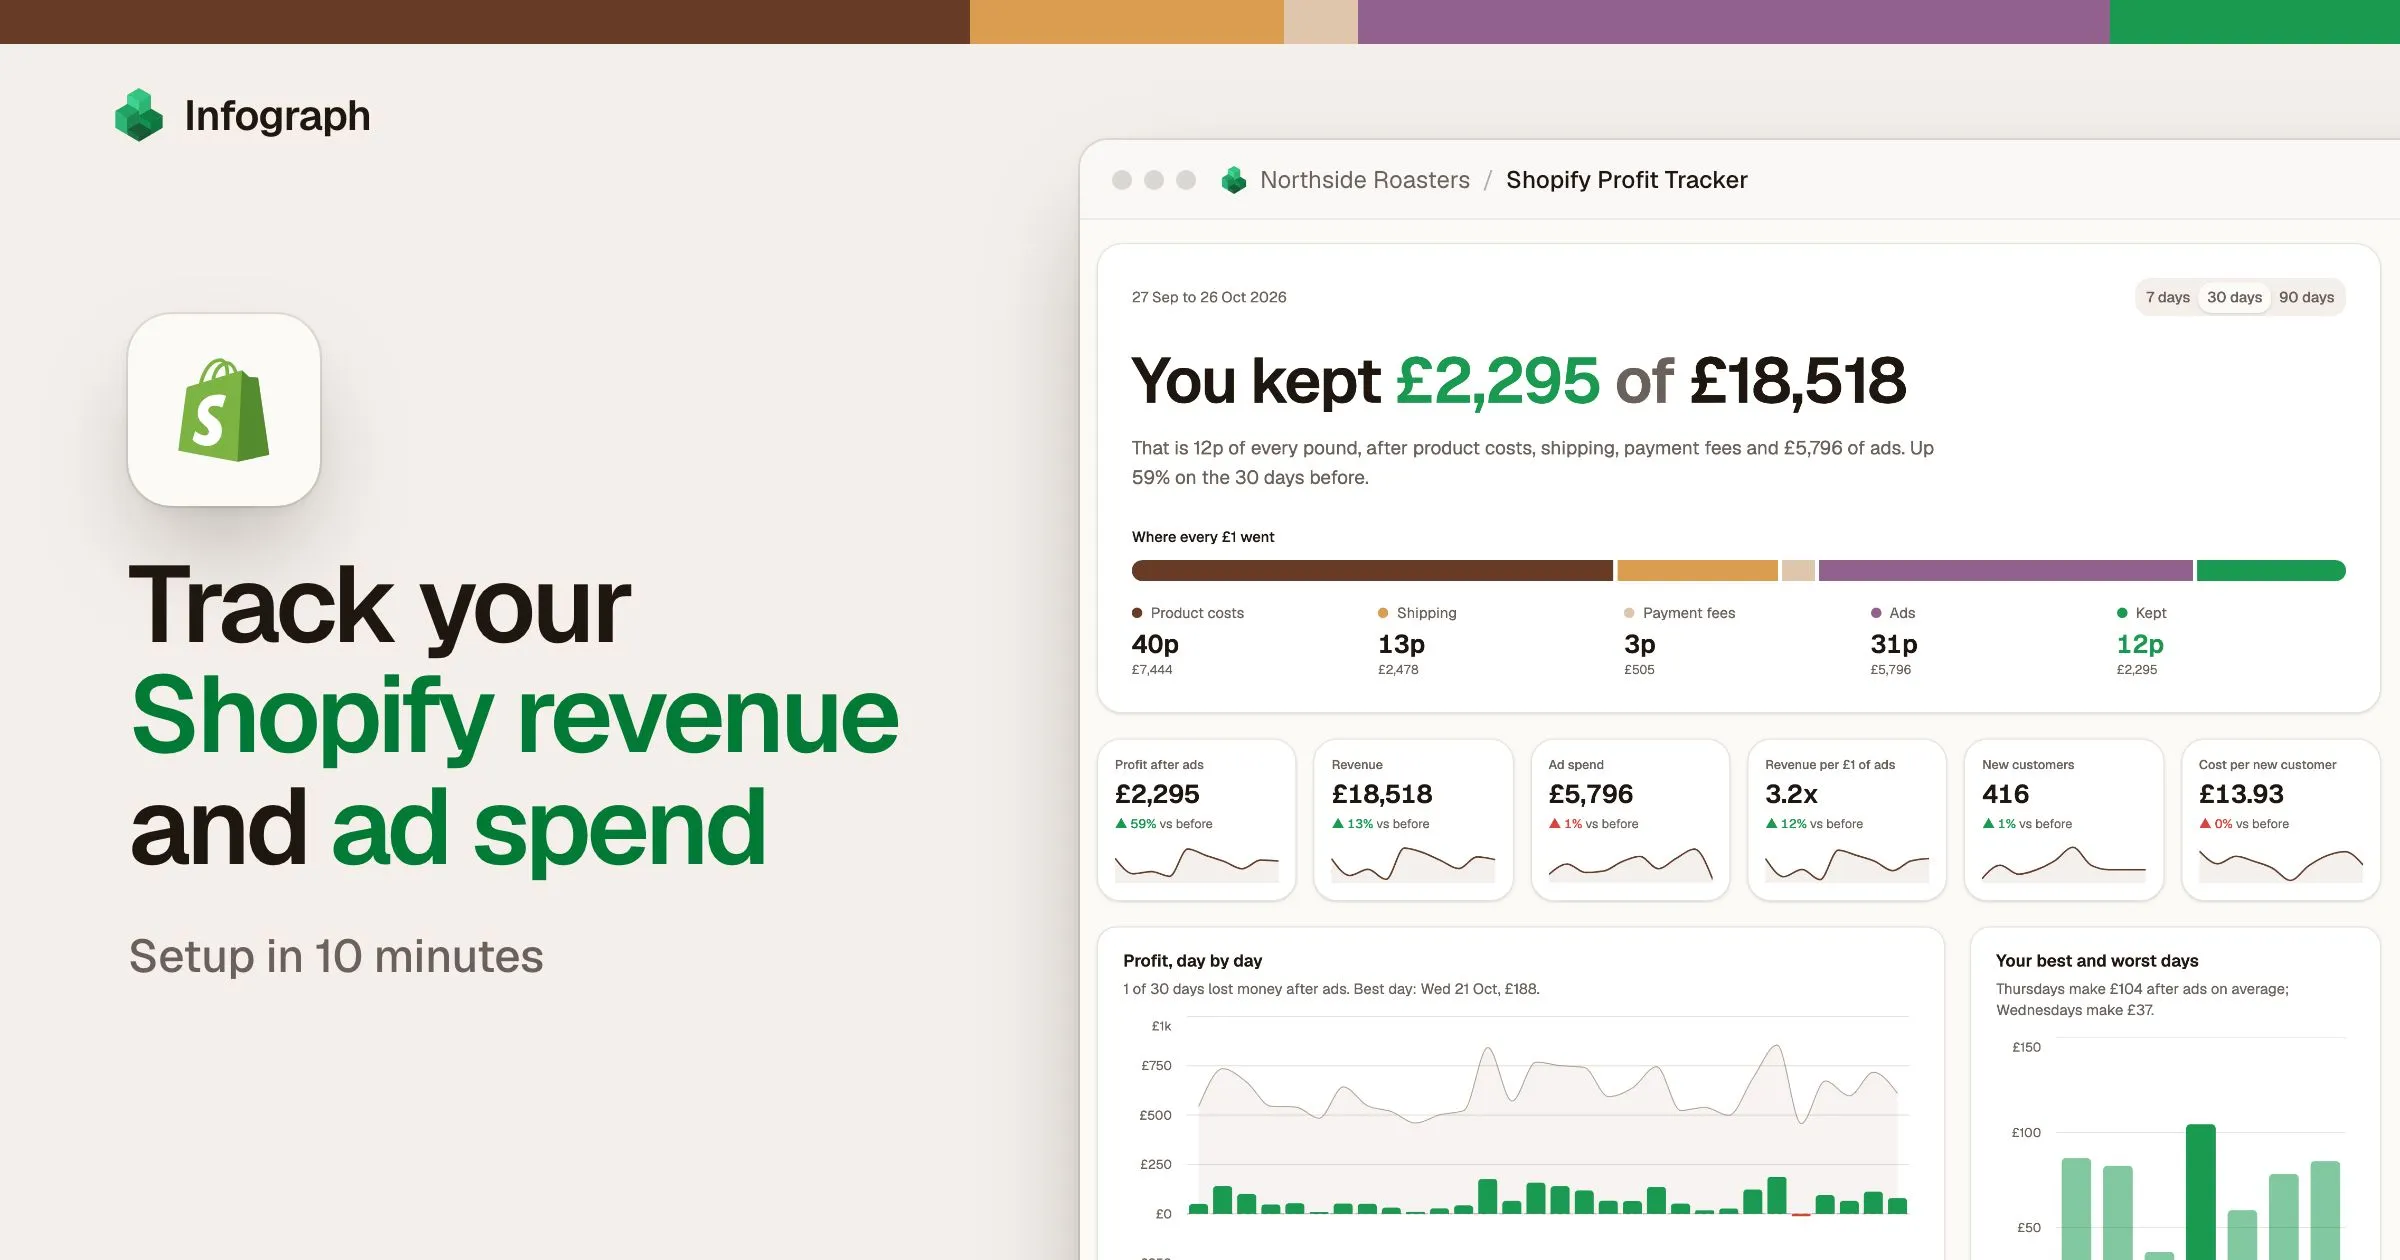
Every pound of sales split into product costs, shipping, fees and ads, so the profit is never a guess. This shop keeps 12p.
See what's improving at a glance
Each figure sits beside the 30 days before, so you spot a slip the morning it shows. Here, profit after ads is up 59%.
Catch the days that lose money
Profit after ads for every day, with the losing ones in red, so you know when your ads aren't paying for themselves. Here, 1 day in 30.
Key takeaways
- Know what you actually make, not just what you sold. This shop took £18,518 in 30 days and kept £2,295 after product costs, shipping, fees and ads: 12p in the pound.
- Check your ads against your till, not their own reports. Meta and Google credited their ads with £16,677 of sales, while new customers spent £10,383 in total. At least £6,293 of that credit went to people who had already bought.
- Put your budget behind the products that pay. The bestseller, a tasting gift box, keeps 33p in the pound. The house espresso sells less, keeps 50p and earns the most.
Made with Infograph
Connected the data
Built the dashboard
Combined Shopify sales, your costs and Meta and Google ad spend into one live dashboard for you to monitor
Shared with your team
Send a link, or work on it together in your account
Connect your apps and databases. Infograph builds live, interactive dashboards for you and your team.
No credit card required
Every Shopify store that advertises asks the same question at the end of the day: did we actually make money? A profit tracker answers it with one number, profit after ads: what’s left of your sales once product costs, shipping, payment fees and ad spend are paid. No single app shows it. Shopify knows what you sold. Meta and Google know what you spent, and each counts sales from customers who were coming back anyway. What your products cost and what the courier charged sit in a spreadsheet you update on a Sunday, if at all.
This dashboard puts the answer on one page every morning, and shows where the money went. Below, we walk through how to read it, using Northside Roasters, a sample coffee shop whose orders, ad accounts and cost sheet are shaped exactly like the data Infograph syncs. Connect your own sources and every panel reads your numbers instead.
- Kept from every £1 of sales, after product costs, shipping, fees and ads
- 12p
- Source: This dashboard, last 30 days
- At least this much of what Meta and Google credit to their ads came from customers who had already bought
- £6,293
- Source: This dashboard, last 30 days
- To win each new customer, whose first order leaves about £10 of profit
- £13.93
- Source: This dashboard: last 30 days, and its payback chart
What the profit tracker connects
Nothing here is typed in or exported. Each number comes from a source you already use:
Shopify. Every order, refund and delivery, and whether the customer is new or coming back, so revenue and new customers come straight from the till. How to connect Shopify.
Facebook Marketing. Daily spend for each campaign, and the sales Meta credits to its ads, so you can set its claims beside what your shop actually took. How to connect Facebook Marketing.
Google Ads. Spend and conversion value for your search and shopping campaigns, in the same view as Meta, so one total shows what all your ads cost. How to connect Google Ads.
Google Sheets. The costs no other app knows: what each product costs to make and pack, what each delivery costs to send, and your payment fee. One small sheet is what turns revenue into profit. How to connect Google Sheets.
One Infograph dashboard, each source kept fresh on its own, with nothing exported or copied.
How to read your Shopify profit
Start with what you kept
The top of the dashboard answers the question before you ask it. For Northside: You kept £2,295 of £18,518 in the last 30 days. Under it, a bar splits every pound of sales into where it went: 40p on products, 13p on shipping, 3p in payment fees, 31p on ads, and 12p kept.
Read it as a budget. When ads are your biggest cost after the products themselves, as they are here, that is where a small change moves profit most. Switch between 7, 30 and 90 days to see whether the split is shifting.
Check six numbers each morning
The row of tiles is your daily check: profit after ads, revenue, ad spend, revenue for each £1 of ads, new customers, and what each new customer cost. Every tile compares itself with the period before, green when it moved the right way and red when it didn’t, so a falling cost counts as good news.
For Northside, profit after ads is up 59% on the 30 days before while ad spend barely moved, up 1%. The extra profit came from selling more, not from spending more.
Spot the days that lose money
The daily chart shows profit after ads for every day, losing days in red, and the panel beside it averages each day of the week. For Northside, only 1 of the last 30 days lost money, and Thursdays make £104 after ads on average against £37 on Wednesdays. Patterns like that tell you when your ads earn their keep and when to pull back.
Check your ads against your till
Ad platforms report their own results, and each counts a sale when someone saw an ad and then bought, including loyal customers who were coming back anyway. This panel sets what they claim beside what your shop actually took.
For Northside, Meta credits its ads with £10,293 of sales in the last 30 days and Google with £6,384: together 2.9 times what they cost. New customers spent £10,383 in total, 1.8 times the ad spend. Even if every one of them came from an ad, at least £6,293 of the platforms’ credit went to people who had already bought. Switch between All, Meta and Google to see the gap for each, and the list beside it shows every campaign’s spend and the return its platform reports.
Why not try
Connecting Typeform for customer satisfaction
Add a short Typeform to your delivery email asking how the order was, with the order number as a hidden field. Connect it, and Infograph can set each product’s satisfaction score beside its profit, so you see whether your bestseller keeps customers happy as well as busy.
Find the products that pay
The products table ranks everything by sales, then shows what each kept after making, shipping and the payment fee, and flags it when your bestseller is not your earner.
For Northside, the tasting gift box sold the most, £4,501, but kept only 33p in the pound. The house espresso sold £4,259, kept 50p and earned the most of anything. Yet the shop’s biggest campaign promotes the gift box: a pound of ads behind the espresso would go further.
Know when a new customer pays back
The payback chart follows each month’s new customers and shows the profit they have brought in by each day after their first order, against a dashed line for what it cost to win one.
For Northside, a first order leaves about £10 of profit, short of the £13.93 each new customer cost in ads. June’s customers had covered it by day 60, July’s by day 45. When the lines cross sooner, you can afford to push harder on ads.
Build a Shopify profit tracker from your store
Connect your shop
Shopify brings every order, refund and delivery, and tells new customers from returning ones.
Connect your ad accounts
Connect each platform you spend on, so all your ad spend, and what each platform claims, sits in one place.
Make a sheet of your costs
Shopify knows what you charged, not what it cost you. Make a Google Sheet with two tabs:
- Unit costs: one row per product, with the same SKU as in Shopify so every sale finds its cost, then what one costs you to make or buy, and its packaging.
- Shipping and fees: one row per delivery method, named as it appears on your Shopify orders, with what a parcel really costs you to send, not what you charge. Then two rows for your payment fee: the percentage, and the fixed amount per order.
When a cost changes, change the sheet: the dashboard picks it up on the next sync. Then connect it:
Prompt your Infograph AI
Four connections need the Plus plan or above, listed at $10 a month with prices set per currency, since Free allows one. Tell Infograph what you want to know, not which charts to draw, and add what matters to the way you run your shop. Something like this:
Build me a profit dashboard for my Shopify shop that I can check every morning. Use my Google Sheet for what products, shipping and card fees cost me, and my Meta and Google ad spend. I want to see what I actually keep after all of it, whether my ads earn what they claim, and which products and new customers really make me money.
Shopify profit tracker questions
Can Infograph show my Shopify profit after ad spend?
Yes. Connect Shopify, the ad accounts you spend on and a Google Sheet of your costs, then ask for it in your own words. Infograph builds the dashboard from your data. The sheet matters: Shopify's sync carries what you charged, not what each product and delivery cost you.
Why do Meta and Google report more sales than my shop actually made?
Each platform credits its ads with any sale that followed someone seeing or clicking an ad, including customers who were coming back anyway, and a sale both platforms touched is counted by both. Setting their claims beside what your shop took, as this dashboard does, shows how far apart they are.
Does Infograph change anything in my store or ad accounts?
No. Infograph only reads. It cannot change your Shopify store, cannot create or change ads, campaigns, budgets or bids on Meta or Google, and reads only the spreadsheets you choose.
How up to date is the dashboard?
Each source syncs on its own, and the dashboard shows the latest sync when you open it. How often depends on your plan: daily on Plus, every 30 minutes on Pro and Teams, and when you ask on Free.
Can I change the dashboard once it's built?
Yes. Ask for what you want in plain words, such as a different period, a new chart or another product split, and Infograph changes it.
I'm having trouble connecting my data to Infograph
Each connector's guide walks through connecting it and lists the errors you might see, with the fix for each:
Is Northside Roasters a real shop?
No. It is a sample store, generated in exactly the shape Infograph syncs from Shopify, Meta Ads, Google Ads and Google Sheets, so every panel on this dashboard can be built from a real store.