Loved by Marketing Built with Infograph
Google Ads, Analytics and Search Console Dashboard: What You Spent and What You Got
A Google Ads and Analytics dashboard with Search Console joined in: track your website, your ad spend and your cost per lead on one page, and see what moved.
Highlights
See what your traffic chart hides
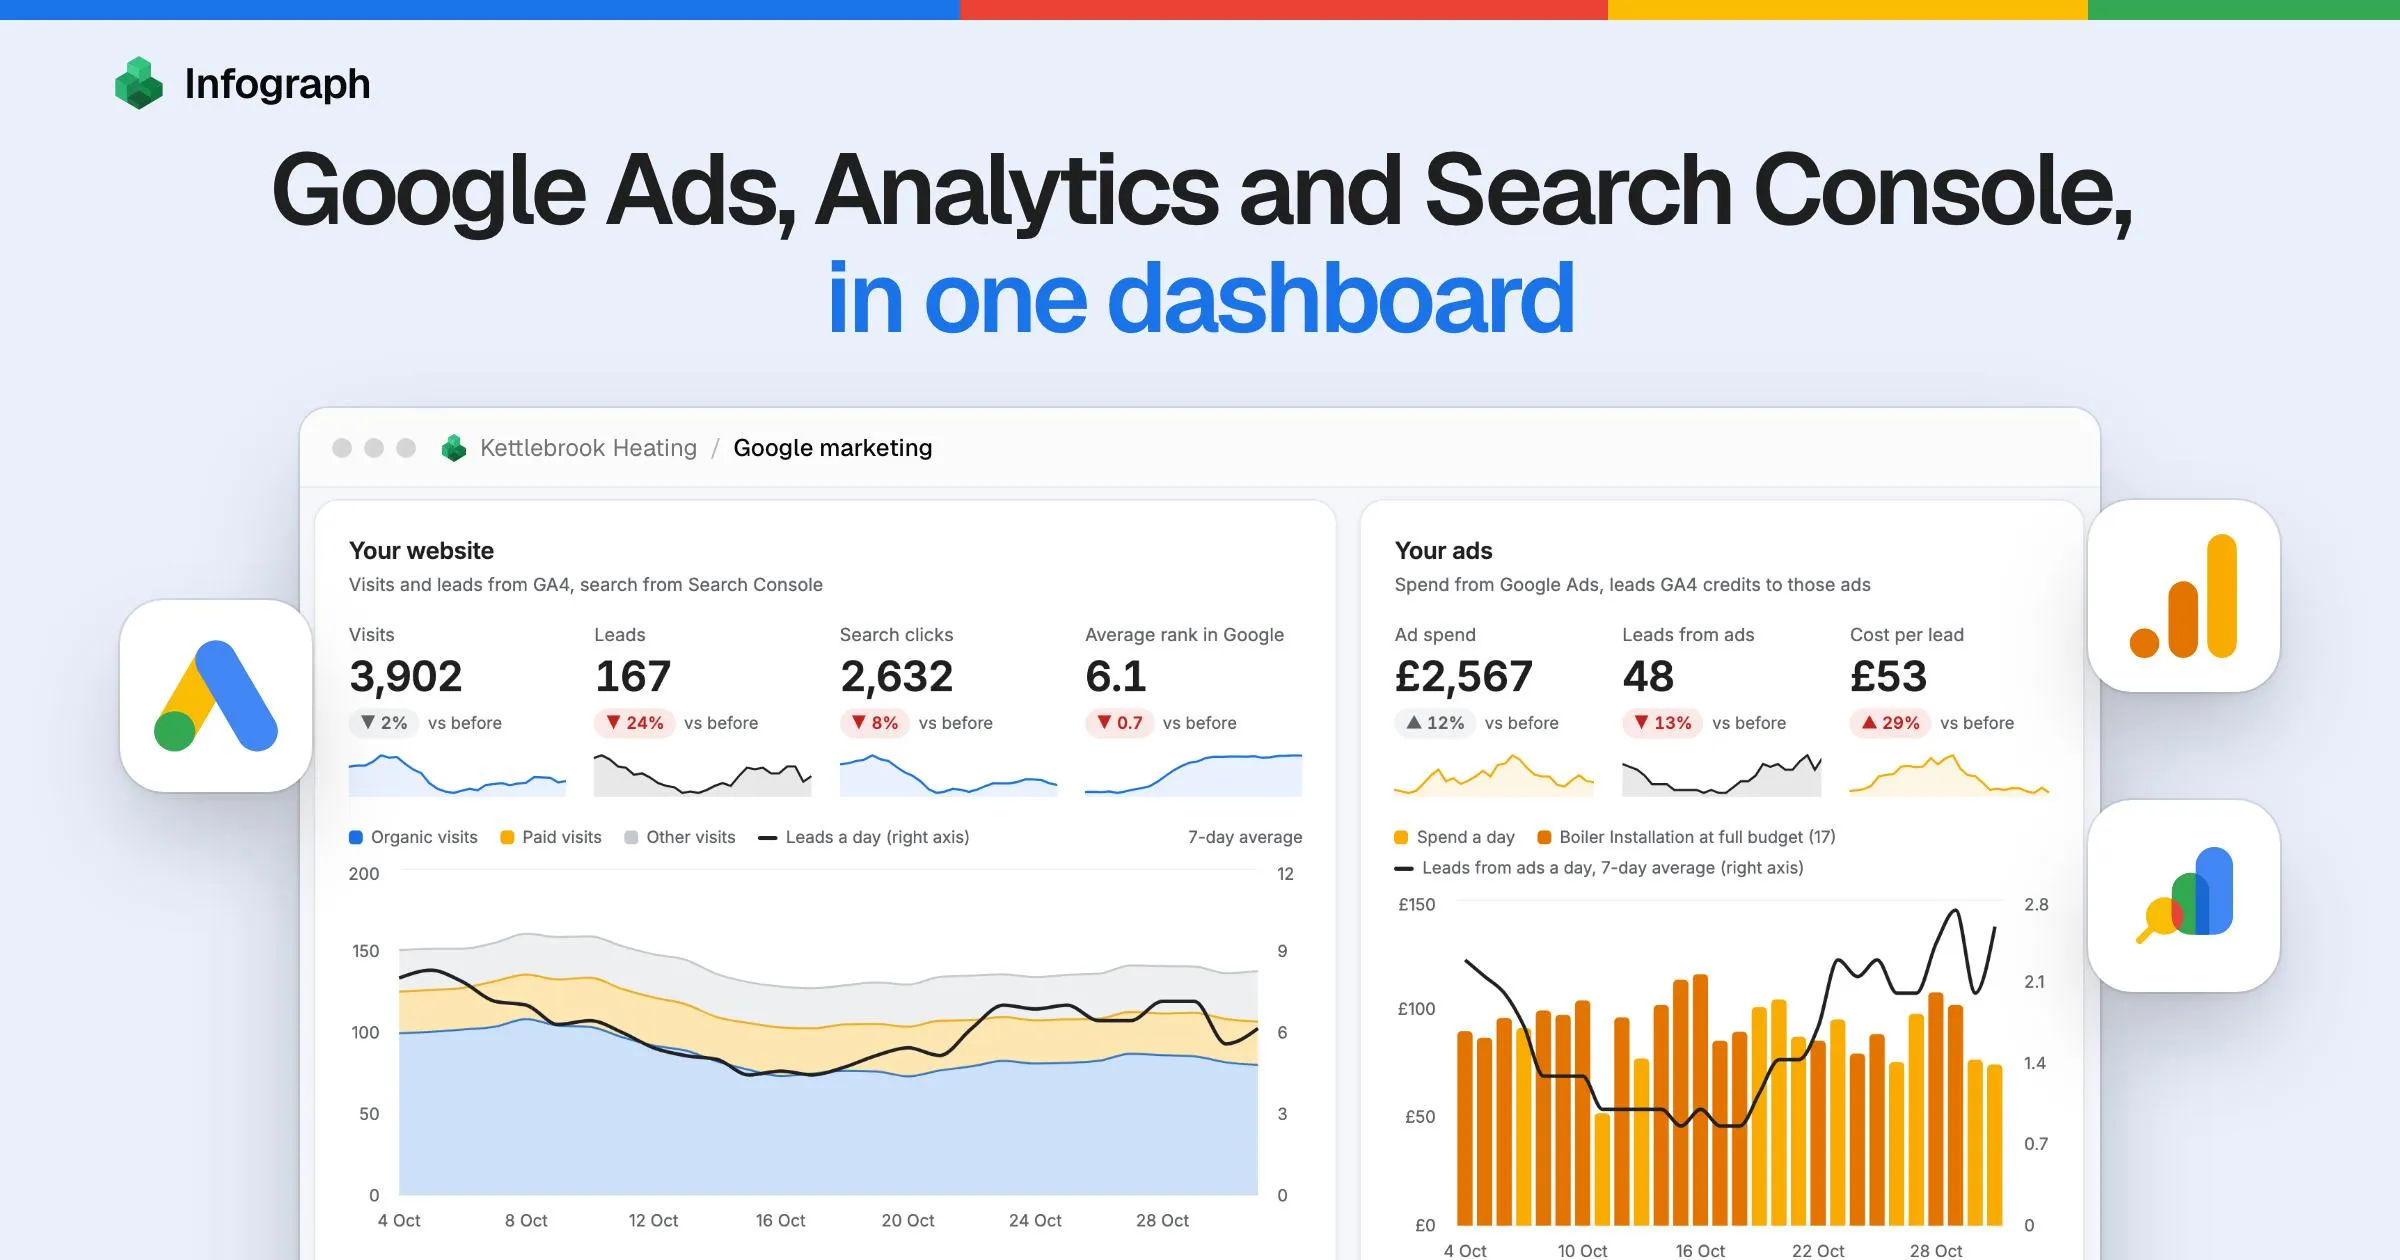
Visits and leads side by side, each with its own trend. In this sample, visits barely moved and leads fell 24%.
Know what a lead really costs
Ad spend over the leads GA4 credits to those ads, tracked against the period before. Here, £53 a lead, up 29%.
Key takeaways
- Track it all on one page. Visits, leads, search clicks, rank, ad spend and cost per lead, each against the period before, for 7, 28 or 90 days.
- See what moved when something drops. Organic search took 48 of this sample’s 52 lost leads, and three service pages slipped in Google over the same weeks.
- Find ad spend worth testing. This sample put £323 on searches that aren’t its own name and where it already ranks in Google’s top 3, listed term by term.
Made with Infograph
Connected the data
Built the dashboard
Combined ad spend, GA4 leads and Search Console rankings into one live dashboard for you to monitor
Shared with your team
Send a link, or work on it together in your account
Connect your apps and databases. Infograph builds live, interactive dashboards for you and your team.
No credit card required
A Google Ads, Analytics and Search Console dashboard is one page that joins what you paid for, what people did on your site and where you rank in Google, so you can answer two questions in a minute: how is my website doing, and what am I getting for my ad spend?
If you do your own marketing, you know the routine. Ads has the cost, GA4 has the visits, Search Console has the rankings, and when something drops you open all three and try to line up the dates in your head. Each is fine at its own job. This puts them on one page you can check every morning.
We’ll walk through it with Kettlebrook Heating, a sample Bristol boiler installer. The business is invented and its numbers are ours, shaped exactly like the tables Infograph syncs from these three connectors. Connect your own accounts and it would track yours.
- What a lead costs from ads with the brand campaign left out, against £53 with it in
- £93
- Source: This dashboard, last 28 days
- Lost leads that were organic, in the same weeks three service pages slipped in Google
- 48 of 52
- Source: This dashboard, last 28 days
What the dashboard connects
Three sign-ins with Google, and each source does one job:
Google Ads. Daily spend, clicks and conversions per campaign, the search terms Google reports for your ads, and each campaign's current budget. This is where the money comes from. How to connect Google Ads.
Google Analytics. Visits and key events by channel, source and campaign, and key events by page. This is the one count of leads used for every channel. How to connect Google Analytics.
Google Search Console. Clicks, impressions and average position by day, page and search query. This is what shows a page slipping, and which paid searches you already rank for. How to connect Google Search Console.
One Infograph dashboard, each source kept fresh on its own, with nothing exported or copied.
How to read your Google Ads and Analytics dashboard
Start with yesterday, then your two cards
The strip at the top is your morning check, with a mark for what’s usual on that weekday. For Kettlebrook’s Monday: £83 spent against a usual £90, 32 ad clicks against 35, 5 leads against 6.5. If a tag broke or a campaign stopped, this is where you’d see it first.
Under it sit your two questions: your website on the left, your ads on the right. A lead here is a GA4 key event, which for this business is a form sent or a call tapped.
Look at where the leads line goes against the coloured area. Visits barely moved over these 28 days, down 2%, while leads fell 24%. A traffic chart alone would have looked fine. On the right, Kettlebrook’s ad spend rose 12% to £2,567, for 48 leads at £53 each, up 29%.
See what moved
When a number drops, “What moved” splits the change by channel. Kettlebrook lost 52 leads: 48 from organic search and 7 from paid, with small gains elsewhere. Switch the bars to visits and you can see how that stayed hidden, because organic lost 228 visits while other channels gained 135.
Beside it, each page that moved gets a track from rank 1 to 10, with a hollow dot for last period and a filled one for this period. Read it with impressions, the times a page showed in search. A worse rank with impressions steady means you likely slipped. Fewer impressions at the same rank often means less demand.
Three service pages stand out in red, and leads on them went from 124 to 75. The boiler grants post lost 133 clicks too, but on fewer impressions at the same rank, and with no leads recorded on the page this period. On a list of lost traffic it looks urgent. It probably isn’t, though it’s worth a look at its queries before you write it off.
Short notes pull that together, and they’re written from the data, so they change with the period and with your account. They say “likely” because that’s all they can be: these things moved at the same time, which is a reason to look and not proof of cause.
Work through the clicks you might already get for free
This panel matches your paid search terms against your organic queries, word for word. Each dot is a search term: further left means you rank higher, higher up means more ad spend. The shaded band is where you already rank well.
For Kettlebrook, £542 of £2,567 went on searches where it already ranks in the top 3, £323 of it on searches that aren’t its own name. Change the band to top 2 and the total falls to £306. Change it to top 5 and it’s £2,103, which shows how much that number depends on where you draw the line.
Treat that money as worth testing. It’s the most a pause could save, never the saving, because rivals may be bidding on your name and an ad can win clicks your organic listing wouldn’t. Google’s own 2012 pause studies found that 50% of ad clicks beside a number one organic result, and 82% beside ranks 2 to 4, were clicks organic wouldn’t have replaced. Those are averages from the company that sells the ads, so your own test is the answer that counts.
Test a group, since one term with 9 clicks a month won’t tell you much. Kettlebrook has four Bedminster terms on one page, £188 in 28 days. Add them as exact-match negatives for four weeks, then compare with the 28 days before. The panel opens up to show the steps, and what the list leaves out: the search terms report doesn’t include Performance Max, and Google hides rare terms.
Why not try
Keeping your SEO costs and job values in a sheet
Connect a Google Sheet with what you pay for SEO each month and what a typical job is worth. Then a cost per lead can sit beside what a lead earns, and organic gets a real cost line of its own. It makes a fourth connection, which Plus allows.
Know what a lead really costs
Cost per lead depends on what you divide by, so the dashboard shows all four. Divide by every lead on the site and ads look like £15, which is flattery, since 119 of those leads came from somewhere else. Google Ads says £35. GA4 says £53. Leave out the brand campaign, whose clickers may well have found you anyway, and it’s £93.
That last line needs a separate brand campaign, because GA4 splits leads by campaign and never by search term. If your brand terms share a campaign with everything else, it won’t be available to you.
Next to it, cost per lead by week shows whether a bad month was one bad week, and paid and organic sit side by side on Google traffic alone.
Check that your Google tools still agree
Ads and GA4 never match, and it’s easy to assume something is broken. Usually nothing is, because they count different things. The panel sets each pair side by side and tracks the gap between them.
Someone can click an ad and leave before GA4 loads, and Search Console trails by two or three days and ends its day on Pacific Time. A steady gap is the ordinary picture. Switch Kettlebrook to 90 days and one chip turns red: GA4’s leads sit 30% below Ads conversions, against 13% before. In a real account, you’d check whether a form changed or your lead event stopped firing.
Should you use Data Studio instead?
You may already know Data Studio, which Google called Looker Studio until April 2026. It’s free, it has Google’s own connectors for these sources, and it can blend up to five of them. If tiles from all three on one screen are what you want, use it, and save the money.
What you’d be building by hand is the rest of this page: windows that end on the same day across tools that report on different days, a join between search terms and search queries, and notes that change with your data. Here you describe what you want to know, and change it by asking. Our comparison goes further.
Build yours from your own Google accounts
Connect Google Ads
Sign in with a Google account that has Read-only access or higher, and pick your account’s Campaigns, Campaign performance and Search term performance. Google offers one permission for its Ads API, so its sign-in screen may ask for more than reading. Infograph’s connector only fetches reports: it has nothing that changes campaigns, budgets or bids.
Connect Google Analytics
Sign in with at least the Viewer role and pick Traffic acquisition, Session campaigns and Pages. Check in GA4 that your form or call is marked as a key event, because that’s what this dashboard counts as a lead.
Connect Search Console
Pick your site’s Performance by date, by page, by query, and by query and page. Infograph loads up to the 16 months of history Search Console keeps. If Google says the app is blocked, your Workspace admin restricts third-party apps, and the guide says what to ask them.
Prompt your Infograph AI
Three connections need the Plus plan or above, listed at $10 a month with prices set per currency, since Free allows one. Then say what you want to track. Something like this:
Build me the page I open every morning to track my marketing, from my Google Ads, Google Analytics and Search Console. A lead is my GA4 key events. Start with yesterday against a usual day. Then track two things with tiles and charts I can read at a glance: how my website is doing, and what I spend and get for it. Show which channels and pages moved, and where my pages rank in Google, and say “likely” when you suggest a reason. Chart the paid search terms where I already rank well, list them as worth testing rather than waste, and let me tick terms to total them. Show where my Google tools disagree, and my cost per lead by week, with and without my brand campaign (if I don’t have one, say so). Let me switch between 7, 28 and 90 days, and stop every comparison on the last day all three tools have data.
Questions about the dashboard
Should I use this or Data Studio?
Data Studio if you want a free report you build yourself. Infograph if you'd rather describe what you want to know and get a page you can change by asking. Infograph needs a paid plan for three connections.
Doesn't Google Ads already have a paid and organic report?
Yes, once Search Console is linked to Google Ads, and it's worth a look. Google says it counts text ads only and reports organic data from the date you started importing it. This dashboard adds your GA4 leads for the page that ranks, and uses the Search Console history Infograph loads, up to 16 months.
Which plan do I need?
Plus or above. This dashboard uses three connections and the Free plan allows one. Plus allows five and syncs daily, Pro syncs every 30 minutes, and Free syncs only when you press the button.
Will it be up to date each morning?
As up to date as your sync. Opening your dashboard while signed in reads the latest synced data. Plus syncs once a day and we don't promise an hour, while Pro syncs every 30 minutes. Infograph's Google syncs stop at yesterday, because today's numbers are incomplete. A public link like the sample's stays as it was when published.
How long does setup take?
Three Google sign-ins, with no keys to copy. We don't quote a time, because the first load brings in up to two years of GA4 and Ads history and 16 months of Search Console, and how long that takes depends on your accounts.
Can I ask the dashboard a question?
Not on the page itself: a published dashboard has no question box. Signed in, you can open it in your Infograph workspace and ask there, over the same connected data, or ask for the dashboard to be changed.
Can Infograph change my ads or my site?
Its connectors only read. They have nothing that changes campaigns, budgets, bids or your GA4 and Search Console properties, so a pause test is something you'd run in Google Ads yourself.
Will the prompt build exactly this page?
No, it builds your own version from your accounts, and it may lay things out differently. This sample was built in Infograph on sample data, with more care over the look than a first answer will have, and you can keep asking until it suits you.
I'm having trouble connecting my data
Each guide covers its errors, including signing in with the wrong Google account and an organisation that blocks the app:
Is Kettlebrook Heating a real business?
No. Kettlebrook Heating is invented and its numbers are sample data, shaped like the tables Infograph syncs from Google Ads, Google Analytics and Search Console. Every figure about it in this post comes from that sample data.