Loved by Developers Built with Infograph
Stripe and Postgres Dashboard: See Which Users Will Pay, and Who's Slipping Away
A dashboard for indie developers that joins your app's Postgres and Stripe: MRR, which first-week actions make users pay, and who's slipping away.
Highlights
Find the action that makes signups pay
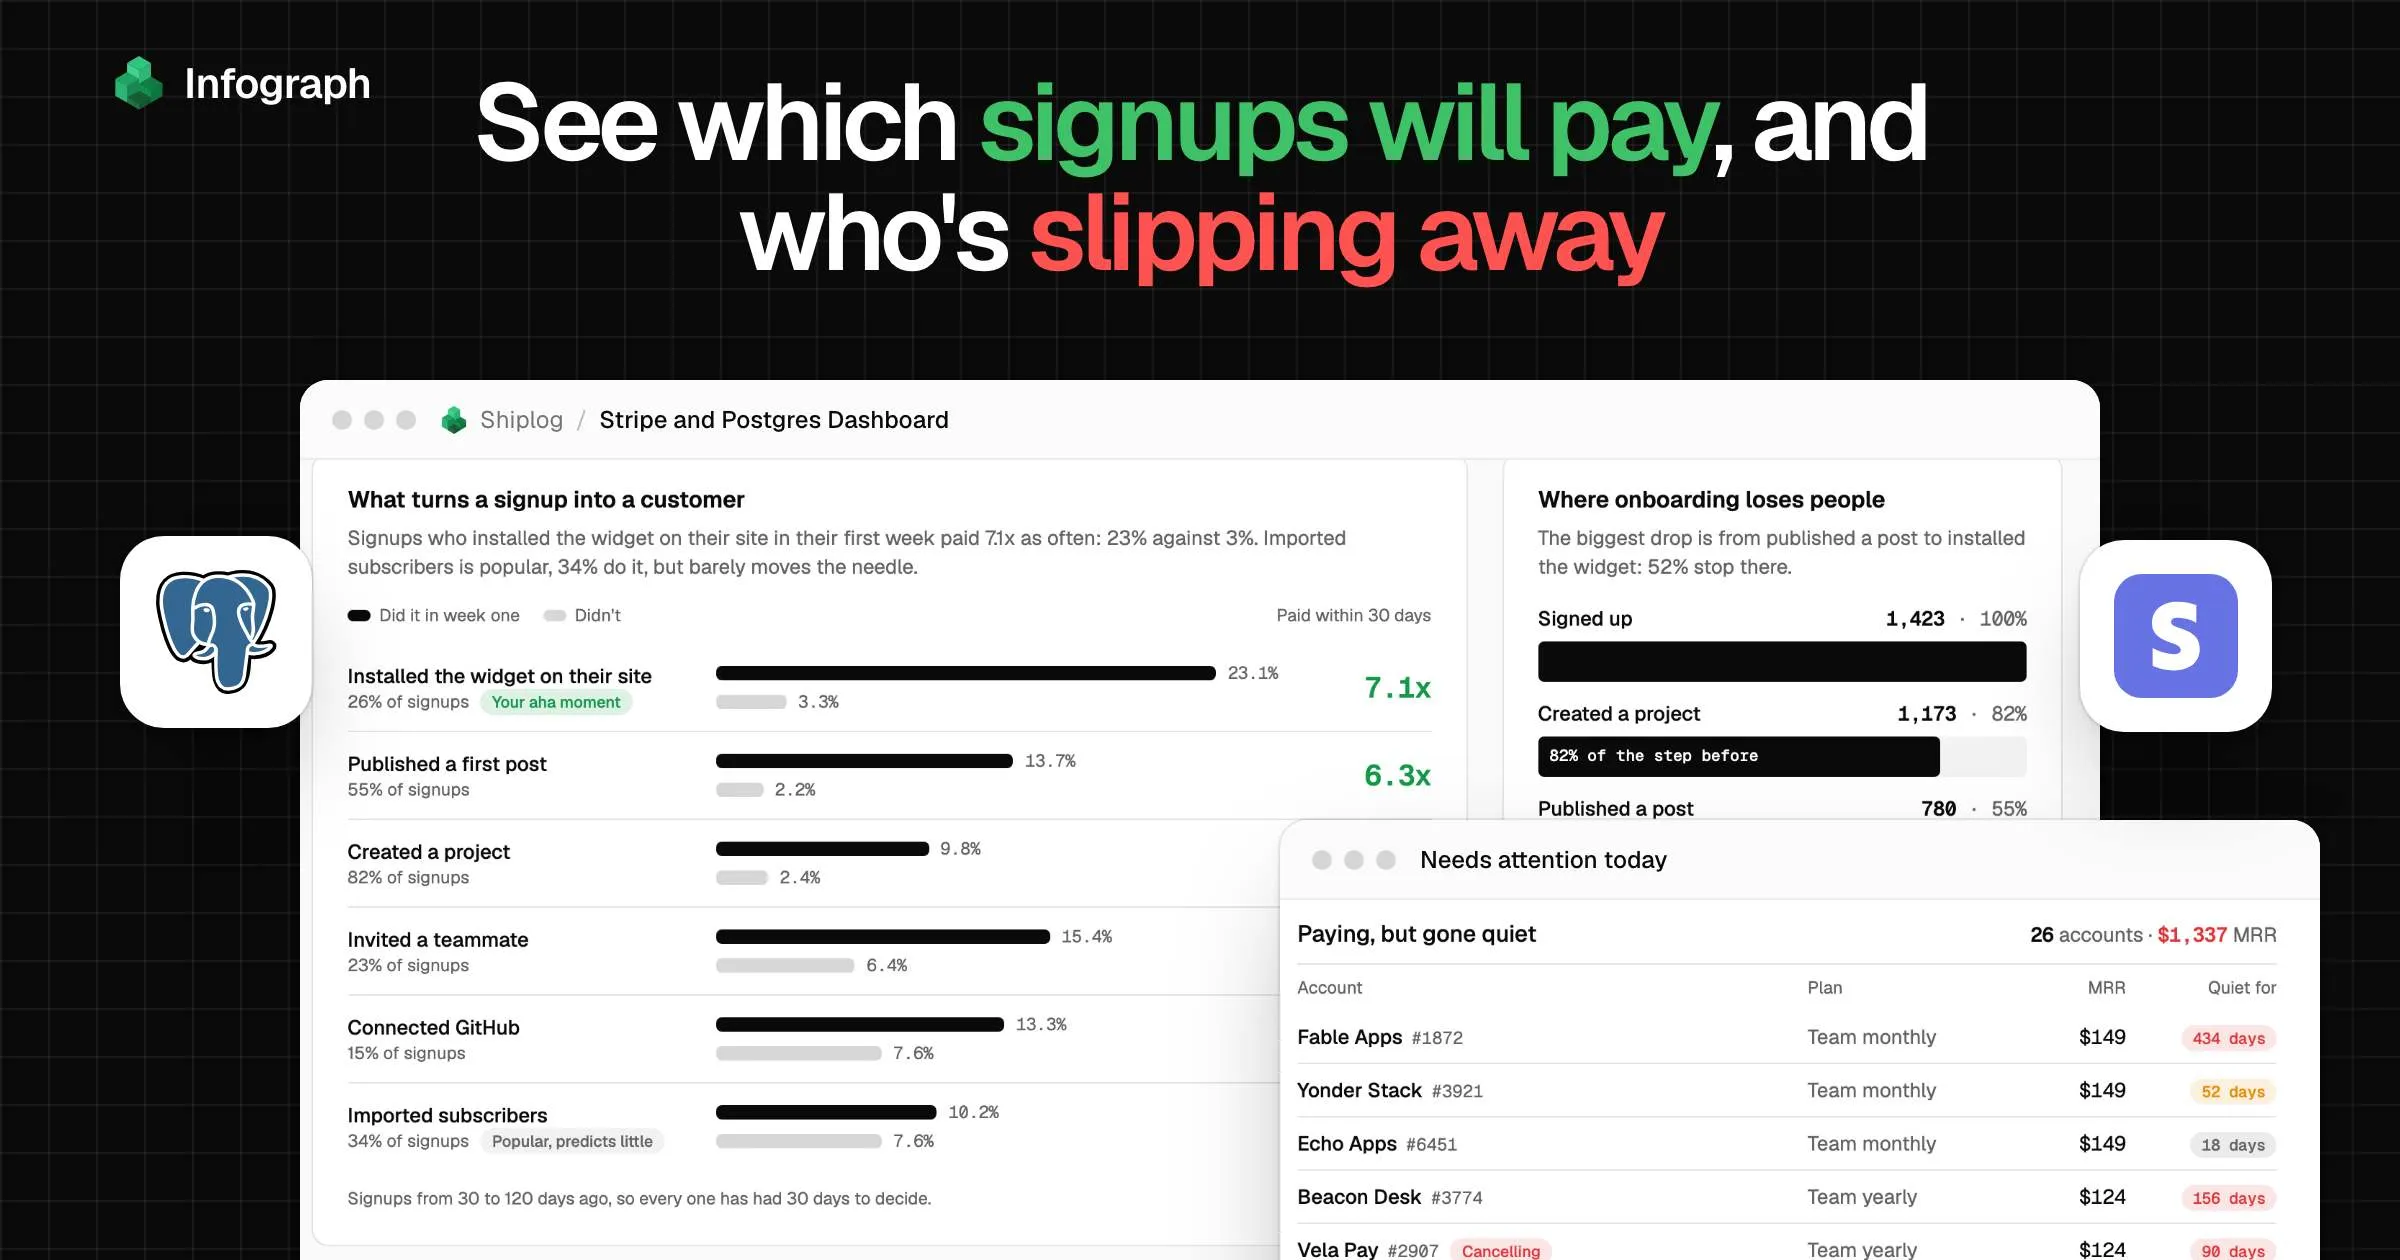
Your events table beside Stripe shows which first-week action goes with paying. Shiplog's signups who installed the widget paid 7.1 times as often as those who didn't.
Spot the popular step that predicts nothing
A third of Shiplog's signups import subscribers, and they pay barely more often than those who don't: 10.2% against 7.6%. That's onboarding effort you can move.
Know who pays but has gone quiet
Paying Stripe customers with no activity in your database for two weeks, highest MRR first. Shiplog has 26, worth $1,337 a month, and a name for each.
Key takeaways
- Put your onboarding where the money is. See which first-week action turns signups into paying customers, and which popular step predicts nothing.
- Get names, not charts. Paying customers who have stopped using your app, and cards Stripe is retrying, listed by MRR and ready for an email today.
- Add nothing to your app. It reads the tables your app already writes and what Stripe already holds, joined on the customer id you store.
Made with Infograph
Connected the data
Built the dashboard
Combined Stripe revenue and your app's Postgres usage into one live dashboard for you to monitor
Shared with your team
Send a link, or work on it together in your account
Connect your apps and databases. Infograph builds live, interactive dashboards for you and your team.
No credit card required
A Stripe dashboard stops at what Stripe knows: MRR, new customers, churn. Join it to your app’s Postgres database and it answers what Stripe can’t: which things people do in their first week make them pay, and which paying customers have stopped using the product.
You built the app, so you can query anything. In practice you open Stripe to check MRR, open a SQL client to count signups, and never get round to joining the two. Stripe knows who pays. Your database knows what everyone did. Neither knows the other exists.
This dashboard joins them on the one column most SaaS apps already have, the Stripe customer id on an account, and puts the answers on one page you can read in a minute each morning. We’ll walk through it with Shiplog, a sample changelog tool whose Postgres tables and Stripe account are shaped exactly like the data Infograph syncs. Connect your own and every panel reads your numbers instead.
- As likely to pay within 30 days, for signups who installed the widget in week one
- 7.1x
- Source: This dashboard: signups from 30 to 120 days ago
- Of MRR from 26 paying accounts that haven't used the app in two weeks or more
- $1,337
- Source: This dashboard, today
- Customers lost to a failed card who were still using the app in their last two weeks
- 11 of 12
- Source: This dashboard, last 90 days
Joining Postgres and Stripe
Two connections, both read-only, and no tracking code to add:
PostgreSQL. The tables your app already writes: accounts with their Stripe customer id, and an events or activity table, so signups and usage come straight from the source of truth. How to connect PostgreSQL.
Stripe. Customers, subscriptions, invoices and charges, so MRR is worked out from what Stripe actually billed, and every cancellation carries Stripe's own reason, including a card that failed. How to connect Stripe.
One Infograph dashboard, each source kept fresh on its own, with nothing exported or copied.
The join is a single column. Here is one Shiplog account across the three tables the dashboard reads:
How to read the Stripe and Postgres dashboard
Start with what moved MRR
The headline is today’s MRR and how far it moved in the period you pick: 7, 30 or 90 days. Beside it, a bridge splits the change into its parts: new customers, upgrades, downgrades, cancellations and failed cards.
A flat month can hide strong sales and heavy churn cancelling each other out, and each needs a different fix. For Shiplog: $19,949 MRR, up $1,577 in 30 days. 51 new customers added $2,139 and upgrades $290, while cancellations took $703, downgrades $100 and one failed card $49.
The six tiles under it compare each figure with the period before. Over 30 days Shiplog looks healthy: new paying customers up 24%, 9.1 customers for every 100 signups, up 13%. Switch to 90 days and it’s less tidy. MRR is up 24%, but conversion has slipped 13% to 7.9 per 100 signups, and MRR lost to churn is up 21% to $2,278. Revenue growth is hiding a leak at both ends, and the panels below show where.
Find the action that makes people pay
This is the panel you can’t get from Stripe or your database alone. It takes everyone who signed up 30 to 120 days ago, so each has had a full month to decide, and asks of each first-week action: how often did the people who did it pay, against the people who didn’t?
For Shiplog the answer is plain. Installing the widget on their own site is the moment that sells: 23.1% of those signups paid within 30 days, against 3.3% of everyone else. Importing subscribers looks like engagement, a third of signups do it, but it barely changes who pays.
It shows which actions go with paying, not that they cause it: people who were going to pay anyway may simply do more. But it tells you which bet to make first. Point half of new signups at the widget in their onboarding, and this panel shows you within a month whether more of them pay. Your own app has a moment like this, and your events table and Stripe can find it.
The funnel beside it shows where people stop on the way. For Shiplog, 82% create a project and 55% publish a post, then the biggest drop comes at the widget: 52% of those who publish never install it. The step that predicts paying is also the one most people skip.
Then ask
Where do my best customers come from?
If your accounts table records where each signup came from, a referrer or a UTM source saved at signup, ask Infograph to split this panel by it. You’ll see which channel sends people who install, invite and pay, and which sends people who look around and leave. It’s the same join, one more column.
Work the list of quiet customers
A customer rarely cancels out of nowhere. They stop logging in first, sometimes for months, and then a charge reminds them. This list finds them: every paying Stripe customer whose account has had no event in your database for 14 days or more, with the most valuable first.
For Shiplog, 26 accounts worth $1,337 of MRR have gone quiet, and only 3 have already asked to cancel. Fable Apps hasn’t logged a single event in 434 days and still pays $149 a month for the Team plan. Start with the top five: a short, personal email asking what changed.
Rescue the customers who didn’t mean to leave
Stripe records why every subscription ended. Put that beside your usage data and churn splits in two: people who chose to leave, and people whose card failed while they were still using the product.
Over 30 days the bridge shows one failed card costing $49, which looks like nothing. Over 90 days the picture changes. This panel counts every subscription that ended in those 90 days, including ones that started in them, so its totals run higher than the bridge’s. For Shiplog, 12 of the 61 customers lost left because a card failed, and 11 of those 12 were still using the app in their last two weeks. Of the 49 who cancelled, only 7 were. Right now Stripe is retrying five more cards worth $345, and all five accounts used Shiplog this week. Send those five a link to update their card today.
Build it from your Postgres and Stripe
Connect your app's database
Infograph connects from a fixed address, shown in the Postgres guide, so first let it through your firewall or security group, or connect through an SSH server if your database is private. Then create a read-only user, connect, and pick the tables you want: your accounts or users, and your events or activity table. Most Postgres hosts have their own guide.
Connect Stripe
Create a restricted key with Read on the resources the Stripe guide lists, and paste it in. A resource left at None still connects, but its table shows an error.
Check you can join the two
Infograph needs one way to match an account in your database to a customer in Stripe. Most apps store the Stripe customer id on the account or user when they first check out; a column like
stripe_customer_idis all it takes. If you don’t keep one, the email on your users table and on Stripe’s customers works too. For the usage panels, any table that records what people do will do, as long as each row has an account id, a timestamp and the kind of event.Prompt your Infograph AI
Say what you want to know about your product and your revenue, and let Infograph work out the queries. Add whatever matters to how you run your SaaS. Something like this:
Build me a dashboard I can check every morning for my SaaS, using my app’s Postgres database and Stripe. I want to see where MRR stands and what moved it, which things people do in their first week predict that they’ll pay, which paying customers have stopped using the product, and whose card is failing while they still use it. Match accounts to Stripe customers on the customer id we store, and treat each kind of event in a signup’s first 7 days as a possible reason they paid. Count an account as quiet after 14 days with no events, and judge signups from 30 to 120 days ago on whether they paid within 30 days.
Stripe and Postgres dashboard questions
Can Infograph join my Postgres data with Stripe?
Yes. Connect both, and Infograph can query your tables and your Stripe data together. It needs one column to match them, usually the Stripe customer id your app stores on an account or user, or the customer's email.
Does Infograph change anything in my database or Stripe account?
No. Infograph only reads. The Postgres guide has you create a read-only user that you can revoke at any time, and you choose which tables it loads. The Stripe key is a restricted key with read access only.
Do I need to add tracking or an analytics SDK to my app?
No. The dashboard reads the tables your app already writes. If you keep an events or activity table, the usage panels read it; if you don't, the timestamps on your own tables, such as when a project or a post was created, can stand in for one.
How is MRR worked out?
From Stripe's subscription invoice lines: each line covers a service period, so MRR on a day is the sum of the lines that cover it, with yearly plans counted at a twelfth. A payment Stripe is still retrying counts until the subscription ends.
My database is on Supabase, Neon or RDS. Does it work?
Yes. Each is Postgres, and most hosts have their own connection guide. MySQL works the same way.
How up to date is the dashboard?
Each source syncs on its own, and the dashboard shows the latest sync when you open it. How often depends on your plan: daily on Plus, every 30 minutes on Pro and Teams.
Can I build this on the free plan?
Not this one: it joins two connections, and the free plan includes one. Plus includes five, enough for your database, Stripe and a few more. You can try Infograph on one source for free first.
I'm having trouble connecting my data to Infograph
Each connector's guide walks through connecting it and lists the errors you might see, with the fix for each:
Is Shiplog a real company?
No. Shiplog is a sample SaaS, generated in exactly the shape Infograph syncs from a Postgres database and Stripe, so every panel on this dashboard can be built from a real app.